10-Q: Quarterly report [Sections 13 or 15(d)]
Published on November 4, 2025
UNITED STATES
SECURITIES AND EXCHANGE COMMISSION
Washington, D.C. 20549
FORM
(Mark One)
QUARTERLY REPORT PURSUANT TO SECTION 13 OR 15(d) OF THE SECURITIES EXCHANGE ACT OF 1934 |
For the quarterly period ended
OR
TRANSITION REPORT PURSUANT TO SECTION 13 OR 15(d) OF THE SECURITIES EXCHANGE ACT OF 1934 |
For the Transition period from ____ to ____
Commission file number
(Exact name of Registrant as specified in its charter)
(State or other jurisdiction of | (I.R.S. Employer | |||
incorporation or organization) | Identification No.) |
(Address of principal executive offices, including zip code)
(
(Registrant’s telephone number, including area code)
Securities registered pursuant to Section 12(b) of the Act:
Title of each class | Trading symbol(s) | Name of each exchange on which registered |
Indicate by check mark whether registrant (1) has filed all reports required to be filed by Section 13 or 15(d) of the Securities Exchange Act of 1934 during the preceding 12 months (or for such shorter period that the registrant was required to file such reports), and (2) has been subject to such filing requirements for the past 90 days.
Indicate by check mark whether the registrant has submitted electronically every Interactive Data File required to be submitted pursuant to Rule 405 of Regulation S-T (§ 232.405 of this chapter) during the preceding 12 months (or for such shorter period that the registrant was required to submit such files).
Indicate by check mark whether the registrant is a large accelerated filer, an accelerated filer a non-accelerated filer, a smaller reporting company, or an emerging growth company. See definitions of “large accelerated filer,” “accelerated filer,” “smaller reporting company,” and “emerging growth company” in Rule 12b-2 of the Exchange Act.
Accelerated filer ☐ | Non-accelerated filer ☐ | Smaller reporting company | Emerging growth company |
If an emerging growth company, indicate by check mark if the registrant has elected not to use the extended transition period for complying with any new or revised financial accounting standards provided pursuant to Section 13(a) of the Exchange Act. ¨☐
Indicate by check mark whether the registrant is a shell company (as defined in Rule 12b-2 of the Exchange Act).
Yes ☐ No
The number of shares of common stock outstanding on October 28, 2025 was
LTC PROPERTIES, INC.
FORM 10-Q
September 30, 2025
INDEX
PART I -- Financial Information | Page | |
| ||
Item 1. | Financial Statements | |
3 | ||
4 | ||
5 | ||
6 | ||
7 | ||
8 | ||
Management’s Discussion and Analysis of Financial Condition and Results of Operations | 37 | |
62 | ||
62 | ||
63 | ||
63 | ||
65 | ||
65 | ||
66 | ||
Available Information
We make available to the public free of charge through our internet website at www.LTCreit.com our Annual Report on Form 10-K, Quarterly Reports on Form 10-Q, Current Reports on Form 8-K, and amendments to those reports filed or furnished pursuant to Section 13(a) or 15(d) of the Securities Exchange Act of 1934, as amended (the “Exchange Act”), as soon as reasonably practicable after we electronically file such reports with, or furnish such reports to, the Securities and Exchange Commission (“SEC”). We also use the “Investors” portion of our www.LTCreit.com website for purposes of compliance with Regulation FD and as a routine channel for distribution of important information to investors and interested parties, including news releases, analyst presentations, financial information, and corporate governance practices. Accordingly, investors and interested parties should monitor the “Investors” portion of our www.LTCreit.com website for the release of this information. Information on our website is not part of this Quarterly Report on Form 10-Q or any of our filings with the SEC unless specifically incorporated by reference.
PART I - FINANCIAL INFORMATION
Item 1. Financial Statements
LTC PROPERTIES, INC.
CONSOLIDATED BALANCE SHEETS
(amounts in thousands, except per share)
|
|
| |||||
September 30, 2025 | December 31, 2024 | ||||||
(unaudited) | (audited) | ||||||
ASSETS | |||||||
Investments: | |||||||
Land | $ | | $ | | |||
Buildings and improvements |
| |
| | |||
Accumulated depreciation and amortization |
| ( |
| ( | |||
Operating real estate property, net |
| |
| | |||
Properties held-for-sale, net of accumulated depreciation: 2025—$ |
| |
| | |||
Real property investments, net |
| |
| | |||
Financing receivables, net of credit loss reserve: 2025—$ | | | |||||
Mortgage loans receivable, net of credit loss reserve: 2025—$ |
| |
| | |||
Real estate investments, net |
| |
| | |||
Notes receivable, net of credit loss reserve: 2025—$ |
| |
| | |||
Investments in unconsolidated joint ventures | | | |||||
Investments, net |
| |
| | |||
Other assets: | |||||||
Cash and cash equivalents |
| |
| | |||
Debt issue costs related to revolving line of credit |
| |
| | |||
Interest receivable |
| |
| | |||
Straight-line rent receivable |
| |
| | |||
Lease incentives | | | |||||
Prepaid expenses and other assets |
| |
| | |||
Total assets | $ | | $ | | |||
LIABILITIES | |||||||
Revolving line of credit | $ | | $ | | |||
Term loans, net of debt issue costs: 2025—$ | — | | |||||
Senior unsecured notes, net of debt issue costs: 2025—$ |
| |
| | |||
Accrued interest |
| |
| | |||
Accrued expenses and other liabilities |
| |
| | |||
Total liabilities |
| |
| | |||
EQUITY | |||||||
Stockholders’ equity: | |||||||
Common stock: $ |
| |
| | |||
Capital in excess of par value |
| |
| | |||
Cumulative net income |
| |
| | |||
Accumulated other comprehensive income |
| |
| | |||
Cumulative distributions |
| ( |
| ( | |||
Total LTC Properties, Inc. stockholders’ equity |
| |
| | |||
Non-controlling interests |
| |
| | |||
Total equity |
| |
| | |||
Total liabilities and equity | $ | | $ | | |||
See accompanying notes.
3
LTC PROPERTIES, INC.
CONSOLIDATED STATEMENTS OF INCOME
(amounts in thousands, except per share, unaudited)
Three Months Ended | Nine Months Ended |
| ||||||||||||
September 30, | September 30, | |||||||||||||
| 2025 |
| 2024 |
| 2025 |
| 2024 |
|
| |||||
Revenues: | ||||||||||||||
Rental income | $ | | $ | | $ | | $ | | ||||||
Resident fees and services | | — | | — | ||||||||||
Interest income from financing receivables | | | | | ||||||||||
Interest income from mortgage loans |
| | |
| |
| | |||||||
Interest and other income |
| |
| |
| |
| | ||||||
Total revenues |
| |
| |
| |
| | ||||||
Expenses: | ||||||||||||||
Interest expense |
| |
| |
| |
| | ||||||
Depreciation and amortization |
| |
| |
| |
| | ||||||
Seniors housing operating expenses | | — | | — | ||||||||||
Write-off of effective interest receivable | | — | | — | ||||||||||
Provision for credit losses |
| |
| |
| |
| | ||||||
Transaction costs | | | | | ||||||||||
Triple-net lease property tax expense | | | | | ||||||||||
General and administrative expenses |
| |
| |
| |
| | ||||||
Total expenses |
| |
| |
| |
| | ||||||
(Loss) income before unconsolidated joint ventures, real estate dispositions and other items | ( | | | | ||||||||||
(Loss) gain on sale of real estate, net | ( | | ( | | ||||||||||
Income from unconsolidated joint ventures | | | | | ||||||||||
Income tax (expense) benefit | ( | — | | — | ||||||||||
Net (loss) income | ( | | | | ||||||||||
Income allocated to non-controlling interests |
| ( |
| ( |
| ( |
| ( | ||||||
Net (loss) income attributable to LTC Properties, Inc. |
| ( |
| | |
| | |||||||
Income allocated to participating securities |
| ( | ( | ( |
| ( | ||||||||
Net (loss) income available to common stockholders | $ | ( | $ | | $ | | $ | | ||||||
Earnings per common share: | ||||||||||||||
Basic | $ | ( | $ | | $ | | $ | | ||||||
Diluted | $ | ( | $ | | $ | | $ | | ||||||
Weighted average shares used to calculate earnings per common share: | ||||||||||||||
Basic |
| |
| |
| |
| | ||||||
Diluted |
| |
| |
| |
| | ||||||
Dividends declared and paid per common share | $ | | $ | | $ | | $ | | ||||||
See accompanying notes.
4
LTC PROPERTIES, INC.
CONSOLIDATED STATEMENTS OF COMPREHENSIVE INCOME
(amounts in thousands, unaudited)
Three Months Ended | Nine Months Ended | |||||||||||||
September 30, | September 30, |
| ||||||||||||
| 2025 |
| 2024 |
| 2025 |
| 2024 |
|
| |||||
Net (loss) income | $ | ( | $ | | $ | | $ | | ||||||
Unrealized gain (loss) on cash flow hedges before reclassification |
| |
| ( |
| ( |
| | ||||||
Gains reclassified from accumulated other comprehensive income to interest expense | ( | ( | ( | ( | ||||||||||
Comprehensive (loss) income | ( | | | | ||||||||||
Less: Comprehensive income allocated to non-controlling interests |
| ( |
| ( |
| ( |
| ( | ||||||
Comprehensive (loss) income attributable to LTC Properties, Inc. | $ | ( | $ | | $ | | $ | | ||||||
5
LTC PROPERTIES, INC.
CONSOLIDATED STATEMENTS OF EQUITY
(amounts in thousands)
Capital in | Cumulative | Total | Non- | ||||||||||||||||||||||||
Common Stock | Excess of | Net | Accumulated | Cumulative | Stockholder's | Controlling | Total | ||||||||||||||||||||
Shares | Amount | Par Value | Income | OCI | Distributions | Equity | Interests | Equity | |||||||||||||||||||
Balance—December 31, 2023 | | $ | | $ | | $ | | $ | | $ | ( | $ | | $ | | $ | | ||||||||||
Issuance of common stock | | | | — | — | — | | — | | ||||||||||||||||||
Issuance of restricted stock | | | ( | — | — | — | — | — | — | ||||||||||||||||||
Common Stock cash distributions ($ | — | — | — | — | — | ( | ( | — | ( | ||||||||||||||||||
Stock-based compensation expense | — | — | | — | — | — | | — | | ||||||||||||||||||
Net income | — | — | — | | — | — | | | | ||||||||||||||||||
Fair market valuation adjustment for interest rate swap | — | — | — | — | | — | | — | | ||||||||||||||||||
Cash paid for taxes in lieu of common shares | ( | — | ( | — | — | — | ( | — | ( | ||||||||||||||||||
Non-controlling interest contributions | — | — | — | — | — | — | — | | | ||||||||||||||||||
Non-controlling interest distributions | — | — | — | — | — | — | — | ( | ( | ||||||||||||||||||
Other | — | — | ( | — | — | — | ( | — | ( | ||||||||||||||||||
Balance—March 31, 2024 | | $ | | $ | | $ | | $ | | $ | ( | $ | | $ | | $ | | ||||||||||
Issuance of common stock | | | | — | — | — | | — | | ||||||||||||||||||
Issuance of restricted stock | | — | — | — | — | — | — | — | — | ||||||||||||||||||
Common Stock cash distributions ($ | — | — | — | — | — | ( | ( | — | ( | ||||||||||||||||||
Stock-based compensation expense | — | — | | — | — | — | | — | | ||||||||||||||||||
Net income | — | — | — | | — | — | | | | ||||||||||||||||||
Fair market valuation adjustment for interest rate swap | — | — | — | — | ( | — | ( | — | ( | ||||||||||||||||||
Cash paid for taxes in lieu of common shares | — | — | — | — | — | — | — | — | — | ||||||||||||||||||
Non-controlling interest contributions | — | — | — | — | — | — | — | | | ||||||||||||||||||
Non-controlling interest distributions | — | — | — | — | — | — | — | ( | ( | ||||||||||||||||||
Other | — | — | ( | — | — | — | ( | — | ( | ||||||||||||||||||
Balance—June 30, 2024 | | $ | | $ | | $ | | $ | | $ | ( | $ | | $ | | $ | | ||||||||||
Issuance of common stock | | | | — | — | — | | — | | ||||||||||||||||||
Issuance of restricted stock | - | — | — | — | — | — | — | — | — | ||||||||||||||||||
Common Stock cash distributions ($ | — | — | — | — | — | ( | ( | — | ( | ||||||||||||||||||
Stock-based compensation expense | — | — | | — | — | — | | — | | ||||||||||||||||||
Net income | — | — | — | | — | — | | | | ||||||||||||||||||
Fair market valuation adjustment for interest rate swap | — | — | — | — | ( | — | ( | — | ( | ||||||||||||||||||
Cash paid for taxes in lieu of common shares | — | — | — | — | — | — | — | — | — | ||||||||||||||||||
Non-controlling interest contributions | — | — | — | — | — | — | — | — | — | ||||||||||||||||||
Non-controlling interest distributions | — | — | — | — | — | — | — | ( | ( | ||||||||||||||||||
Balance—September 30, 2024 | | $ | | $ | | $ | | $ | | $ | ( | $ | | $ | | $ | | ||||||||||
Balance—December 31, 2024 | | $ | | $ | | $ | | $ | | $ | ( | $ | | $ | | $ | | ||||||||||
Issuance of common stock | | | | — | — | — | | — | | ||||||||||||||||||
Issuance of restricted stock | | | ( | — | — | — | — | — | — | ||||||||||||||||||
Common Stock cash distributions ($ | — | — | — | — | — | ( | ( | — | ( | ||||||||||||||||||
Stock-based compensation expense | — | — | | — | — | — | | — | | ||||||||||||||||||
Net income | — | — | — | | — | — | | | | ||||||||||||||||||
Vesting of performance-based stock units | | | ( | — | — | — | — | — | — | ||||||||||||||||||
Fair market valuation adjustment for interest rate swap | — | — | — | — | ( | — | ( | — | ( | ||||||||||||||||||
Cash paid for taxes in lieu of common shares | ( | ( | ( | — | — | — | ( | — | ( | ||||||||||||||||||
Acquisitions of non-controlling interest | — | — | | — | — | — | | ( | ( | ||||||||||||||||||
Non-controlling interest distributions | — | — | — | — | — | — | — | ( | ( | ||||||||||||||||||
Other | — | — | ( | — | — | — | ( | — | ( | ||||||||||||||||||
Balance—March 31, 2025 | | $ | | $ | | $ | | $ | | $ | ( | $ | | $ | | $ | | ||||||||||
Issuance of common stock | | | | — | — | — | | — | | ||||||||||||||||||
Issuance of restricted stock | | — | — | — | — | — | — | — | — | ||||||||||||||||||
Common Stock cash distributions ($ | — | — | — | — | — | ( | ( | — | ( | ||||||||||||||||||
Stock-based compensation expense | — | — | | — | — | — | | — | | ||||||||||||||||||
Net income | — | — | — | | — | — | | | | ||||||||||||||||||
Vesting of performance-based stock units | | — | — | — | — | — | — | — | — | ||||||||||||||||||
Fair market valuation adjustment for interest rate swap | — | — | — | — | ( | — | ( | — | ( | ||||||||||||||||||
Cash paid for taxes in lieu of common shares | ( | — | ( | — | — | — | ( | — | ( | ||||||||||||||||||
Non-controlling interest distributions | — | — | — | — | — | — | — | ( | ( | ||||||||||||||||||
Balance—June 30, 2025 | | $ | | $ | | $ | | $ | | $ | ( | $ | | $ | | $ | | ||||||||||
Issuance of common stock | | | | — | — | — | | — | | ||||||||||||||||||
Common Stock cash distributions ($ | — | — | — | — | — | ( | ( | — | ( | ||||||||||||||||||
Stock-based compensation expense | — | — | | — | — | — | | — | | ||||||||||||||||||
Net (loss) income | — | — | — | ( | — | — | ( | | ( | ||||||||||||||||||
Fair market valuation adjustment for interest rate swap | — | — | — | — | ( | — | ( | — | ( | ||||||||||||||||||
Non-controlling interest distributions | — | — | — | — | — | — | — | ( | ( | ||||||||||||||||||
Balance—September 30, 2025 | | $ | | $ | | $ | | $ | | $ | ( | $ | | $ | | $ | | ||||||||||
6
LTC PROPERTIES, INC.
CONSOLIDATED STATEMENTS OF CASH FLOWS
(amounts in thousands, unaudited)
Nine Months Ended September 30, |
| |||||||
| 2025 |
| 2024 |
|
| |||
OPERATING ACTIVITIES: |
|
| ||||||
Net income | $ | | $ | | ||||
Adjustments to reconcile net income to net cash provided by operating activities: | ||||||||
Depreciation and amortization |
| |
| | ||||
Stock-based compensation expense |
| |
| | ||||
(Loss) gain on sale of real estate, net |
| |
| ( | ||||
Income tax benefit | ( | — | ||||||
Income from unconsolidated joint ventures |
| ( |
| ( | ||||
Income distributions from unconsolidated joint ventures | | | ||||||
Straight-line rental adjustment | |
| | |||||
Adjustment for collectability of straight-line rental income | | | ||||||
Adjustment for collectability of lease incentives | | — | ||||||
Amortization of lease incentives | | | ||||||
Write-off of effective interest receivable | | — | ||||||
Provision for credit losses |
| |
| | ||||
Application of interest reserve | — | ( | ||||||
Amortization of debt issue costs | | | ||||||
Other non-cash items, net |
| |
| | ||||
Change in operating assets and liabilities | ||||||||
Lease incentives funded | — | ( | ||||||
Increase in interest receivable |
| ( |
| ( | ||||
Increase (decrease) in accrued interest payable |
| |
| ( | ||||
Net change in other assets and liabilities |
| ( |
| ( | ||||
Net cash provided by operating activities |
| |
| | ||||
INVESTING ACTIVITIES: | ||||||||
Investment in real estate properties |
| ( |
| ( | ||||
Investment in real estate capital improvements |
| ( |
| ( | ||||
Proceeds from sale of real estate, net |
| |
| | ||||
Investment in financing receivables | ( | ( | ||||||
Investment in real estate mortgage loans receivable |
| ( |
| ( | ||||
Principal payments received on mortgage loans receivable |
| |
| | ||||
Investments in unconsolidated joint ventures |
| ( |
| ( | ||||
Proceeds from liquidation of investments in unconsolidated joint ventures | | — | ||||||
Advances and originations under notes receivable |
| ( |
| ( | ||||
Principal payments received on notes receivable |
| |
| | ||||
Net cash (used in) provided by investing activities |
| ( |
| | ||||
FINANCING ACTIVITIES: | ||||||||
Borrowings from revolving line of credit |
| |
| | ||||
Repayment of term loans | ( | — | ||||||
Repayment of revolving line of credit |
| ( |
| ( | ||||
Principal payments on senior unsecured notes | ( | ( | ||||||
Proceeds from common stock issued |
| |
| | ||||
Payments of common share issuance costs | ( | ( | ||||||
Distributions paid to stockholders |
| ( |
| ( | ||||
Acquisition of and distributions paid to non-controlling interests |
| ( |
| ( | ||||
Financing costs paid |
| ( |
| ( | ||||
Cash paid for taxes in lieu of shares upon vesting of restricted stock | ( | ( | ||||||
Other |
| ( |
| ( | ||||
Net cash provided by (used in) financing activities |
| |
| ( | ||||
Increase in cash and cash equivalents |
| |
| | ||||
Cash and cash equivalents, beginning of period |
| |
| | ||||
Cash and cash equivalents, end of period | $ | | $ | | ||||
Supplemental disclosure of cash flow information: | ||||||||
Interest paid | $ | | $ | | ||||
Non-cash investing and financing transactions: | ||||||||
Contribution from non-controlling interest | $ | — | $ | | ||||
Investment in financing receivables | $ | — | $ | ( | ||||
Exchange of mortgage loans for controlling interests in joint ventures accounted for as financing receivables | $ | — | $ | | ||||
Accretion of interest reserve recorded as mortgage loan receivable | $ | — | $ | | ||||
Write-off of notes receivable | $ | ( | $ | — | ||||
Decrease in fair value of interest rate swap agreements | $ | ( | $ | ( | ||||
Distributions paid to non-controlling interests | $ | ( | $ | | ||||
Transfer of joint venture partner's non-controlling interest to LTC | $ | | $ | — | ||||
Distributions paid to non-controlling interests related to property sale | $ | — | $ | | ||||
See accompanying notes.
7
1. | General |
LTC Properties, Inc., a health care real estate investment trust (“REIT”), was incorporated on May 12, 1992 in the State of Maryland and commenced operations on August 25, 1992. We invest primarily in seniors housing and health care properties primarily through sale-leasebacks, mortgage financing, joint ventures and structured finance solutions including preferred equity and mezzanine lending. Additionally, during the second quarter of 2025, we began utilizing the structure authorized by the REIT Investment Diversification and Empowerment Act of 2007 (Commonly referred to as “RIDEA”) as permitted by the Housing and Economic Recovery Act of 2008.
Our primary seniors housing and health care property classifications include skilled nursing centers (“SNF”), independent living communities (“ILF”), assisted living communities (“ALF”), memory care communities (“MC”) and combinations thereof. Independent living communities, assisted living communities, memory care communities and combinations thereof are included in the seniors housing communities classification (“SH”). We also invest in other (“OTH”) types of properties, such as land parcels, projects under development (“UDP”) and behavioral health care hospitals.
Our primary objectives are to create, sustain and enhance stockholder equity value and provide current income for distribution to stockholders through real estate investments in seniors housing and health care properties managed by experienced operators. To meet these objectives, we attempt to invest in properties that provide an opportunity for additional value and current returns to our stockholders and diversify our investment portfolio by geographic location, operator, property classification and form of investment.
8
2. | Basic of Presentation and Accounting Policies |
Basic of Presentation
We have prepared consolidated financial statements included herein without audit and in the opinion of management have included all adjustments necessary for a fair presentation of the consolidated financial statements pursuant to the rules and regulations of the Securities and Exchange Commission (“SEC”). Certain information and note disclosures normally included in financial statements prepared in accordance with U.S. generally accepted accounting principles (“GAAP”) have been condensed or omitted pursuant to rules and regulations governing the presentation of interim financial statements.
Principles of Consolidation
The accompanying consolidated financial statements include the accounts of our company and its wholly-owned subsidiaries. All significant intercompany accounts and transactions have been eliminated in consolidation. The results of operations for the three and nine months ended September 30, 2025 and 2024 are not necessarily indicative of the results for a full year.
Segments
As explained above, we began utilizing the RIDEA structure in the second quarter of 2025, and established a seniors housing operating portfolio (“SHOP”) segment. Accordingly, effective in the second quarter of 2025, we conduct and manage our business as
Our real estate investments segment consists of owned properties that are leased pursuant to non-cancelable triple-net operating (“NNN” or “Triple-Net”) leases, financing receivables, mortgage loans, notes receivable and unconsolidated joint ventures.
During 2025, we terminated the Anthem Memory Care, LLC (“Anthem”) and New Perspective Senior Living, LLC. (“New Perspective”) Triple-Net master leases and converted the
Revenue Recognition-SHOP
Resident fees and services represent all amounts earned from residents within our SHOP segment, as outlined in individual resident agreements. Fees are billed monthly based on contracted rates in the resident agreements, or where applicable, reimbursement rates established by Medicaid and Medicare. Resident fees and services revenue is derived from amounts paid by residents and/or third-party payors. Resident agreements typically vary in duration. Revenue is recognized in accordance with Accounting Standards Codification (“ASC”) 606, Revenue from Contracts with Customers (“ASC 606”) when performance obligations are satisfied.
9
LTC PROPERTIES, INC.
NOTES TO CONSOLIDATED FINANCIAL STATEMENTS CONTINUED
(Unaudited)
3. | Real Estate Investments |
Independent living communities, assisted living communities, memory care communities and combinations thereof are included in the seniors housing communities classification (“SH”).
Any reference to the number of properties or facilities, number of units, number of beds, number of operators and yield on investments in real estate are unaudited and outside the scope of our independent registered public accounting firm’s review of our consolidated financial statements in accordance with the standards of the Public Company Accounting Oversight Board.
Owned Properties
Our owned property investments include
Average |
| |||||||||||||||
Percentage | Number | Number of | Investment |
| ||||||||||||
Gross | of | of | SNF | SH | per |
| ||||||||||
Type of Property | Investment | Investment | Properties (1) | Beds | Units | Bed/Unit |
| |||||||||
Seniors Housing-NNN | $ | | | % | | — | | $ | | |||||||
Seniors Housing-SHOP | | | % | | — | | $ | | ||||||||
Seniors Housing | | | % | | — | | $ | | ||||||||
Skilled Nursing | | | % | | | | $ | | ||||||||
Other (2) | | | % | | | — | n/a | |||||||||
Total | $ | | | % | | | ||||||||||
| (1) | We own properties in |
| (2) | Includes |
NNN | SHOP | Total | ||||||||||||||||||||||
Percentage | Number | Percentage | Number | Percentage | Number | |||||||||||||||||||
Gross | of | of | Gross | of | of | Gross | of | of | ||||||||||||||||
Type of Property | Investment | Investment | Properties | Investment | Investment | Properties | Investment | Investment | Properties | |||||||||||||||
Seniors Housing | $ | | % | | $ | | % | | $ | | % | | ||||||||||||
Skilled Nursing | | % | | — | — | % | — | | % | | ||||||||||||||
Other | | % | | — | — | % | — | | % | | ||||||||||||||
Total | $ | | % | | $ | | % | | $ | | % | |||||||||||||
During the nine months ended September 30, 2025 and 2024, we invested in the following capital improvement projects in our owned properties (dollar amounts in thousands):
Nine Months Ended September 30, | |||||||||||||
Type of Property | 2025 | 2024 | |||||||||||
NNN | SHOP | NNN | SHOP | ||||||||||
Seniors Housing Communities | $ | | $ | | $ | | $ | — | |||||
Skilled Nursing Centers | | — | | — | |||||||||
Total | $ | | $ | | $ | | $ | — | |||||
10
LTC PROPERTIES, INC.
NOTES TO CONSOLIDATED FINANCIAL STATEMENTS CONTINUED
(Unaudited)
Intangible Assets. We make estimates as part of our allocation of the purchase price of acquisitions to various components of the acquisition based upon the fair value of each component. In determining fair value, we use current appraisals or other third-party opinions of value. The most significant components of our allocations are typically the allocation of fair value to land and buildings, and for certain of our acquisitions, in-place leases and other intangible assets. In the case of the value of in-place leases, we make estimates based on the evaluation of the specific characteristics of each tenant’s lease. Factors considered include estimates of carrying costs during the hypothetical expected lease-up periods, market conditions and costs to execute similar leases. The following is a summary of the carrying amount of intangible assets as of September 30, 2025 and December 31, 2024 (in thousands):
September 30, 2025 | December 31, 2024 | |||||||||||||||||||||
Accumulated | Accumulated | |||||||||||||||||||||
Assets | Cost | Amortization | Net | Cost | Amortization | Net | ||||||||||||||||
In-place leases | $ | | (1) | $ | ( | (2) | $ | | $ | | (1) | $ | ( | (2) | $ | | ||||||
Tax abatement intangible | $ | | (3) | $ | ( | (3) | $ | | $ | | (3) | $ | ( | (3) | $ | | ||||||
| (1) | Included in the Buildings and improvements line item in our Consolidated Balance Sheets. Increase relates to acquisition of |
| (2) | Included in the Accumulated depreciation and amortization line item in our Consolidated Balance Sheets. |
| (3) | Included in the Prepaid expenses and other assets line item in our Consolidated Balance Sheets. |
The following table provides future amortization expenses related to the intangible assets at September 31, 2025 (in thousands):
October- | ||||||||||||||||||||||||
December | ||||||||||||||||||||||||
| Total |
| 2025 | 2026 |
| 2027 |
| 2028 |
| 2029 |
| 2030 |
| Thereafter | ||||||||||
In-place leases (1) | $ | | $ | | $ | | $ | | $ | | $ | | $ | | $ | | ||||||||
Tax abatement intangible (2) |
| | |
| |
| |
| |
| |
| |
| | |||||||||
$ | | $ | | $ | | $ | | $ | | $ | | $ | | $ | | |||||||||
| (1) | Recorded as depreciation expense excluded in the Depreciation and amortization line item on our Consolidated Statements of Income. |
| (2) | Recorded as Property tax expense on our Consolidated Statements of Income. |
Owned Properties- Triple-Net
Our Triple-Net leases require the lessee to pay all taxes, insurance, maintenance and repairs, capital and non-capital expenditures and other costs necessary in the operations of the facilities. Many of the leases contain renewal options. The majority of our leases contain provisions for specified annual increases over the rents of the prior year. Many of our existing leases contain renewal options that, if exercised, could result in the amount of rent payable upon renewal being greater than that currently being paid.
11
LTC PROPERTIES, INC.
NOTES TO CONSOLIDATED FINANCIAL STATEMENTS CONTINUED
(Unaudited)
The following table outlines information related to our Triple-Net lease extensions during the nine months ended September 30, 2025 (dollar amounts in thousands):
Number | Number | ||||||||||||
Gross | of | of | Original | Extended | |||||||||
Type of Property | Investment | Properties | Beds/Units | State | Maturity | Maturity | |||||||
SH | $ | | | IL, MI, OH | May 31, 2025 | May 31, 2026 | |||||||
SNF | | | AL, NM | April 30, 2026 | (1) | April 30, 2031 | |||||||
SH | | | GA, SC | December 31, 2025 | December 31, 2026 | ||||||||
SH | | | TX | February 28, 2025 | February 28, 2026 | ||||||||
SNF | | | SC | February 28, 2026 | February 28, 2031 | ||||||||
SNF | | | TN | December 31, 2025 | (2) | December 31, 2026 | |||||||
$ | | |
| (1) | During the third quarter of 2025, Genesis Healthcare, Inc. (“Genesis”) filed for Chapter 11 bankruptcy. Genesis has paid their contractual rent through November 2025. |
| (2) | The purchase option window provided in the master lease, which expired on December 31, 2024, was extended for another year to December 31, 2025. During the third quarter of 2025, the operator provided an election notice to exercise its purchase option. |
Additionally, during 2025, we terminated
Also, during 2025, we terminated the Anthem Triple-Net master leases and converted the communities covered under the master leases into our SHOP segment. In conjunction with the conversion, during 2025, we wrote-off Anthem’s working capital note of $
We monitor the collectability of our receivable balances, including deferred rent receivable balances, on an ongoing basis. We write-off uncollectible operator receivable balances, including straight- line rent receivable and lease incentives balances, as a reduction to rental income in the period such balances are no longer probable of being collected. Therefore, recognition of rental income is limited to the lesser of the amount of cash collected or rental income reflected on a “straight-line” basis for those customer receivable balances deemed uncollectible. During the three months ended September 30, 2025, we wrote-off straight-line rent receivable balance of $
12
LTC PROPERTIES, INC.
NOTES TO CONSOLIDATED FINANCIAL STATEMENTS CONTINUED
(Unaudited)
We continue to take into account the current financial condition of our operators in our estimation of uncollectible accounts at September 30, 2025. We are closely monitoring the collectability of such rents and will adjust future estimations as appropriate as further information becomes known.
The following table summarizes components of our rental income for the three and nine months ended September 30, 2025 and 2024 (in thousands):
Three Months Ended | Nine Months Ended | ||||||||||||
September 30, | September 30, | ||||||||||||
Rental Income | 2025 | 2024 | 2025 | 2024 | |||||||||
Contractual cash rental income | $ | | (1) | $ | | (1) | $ | | (2) | $ | | (2) | |
Variable cash rental income (3) | | | | | |||||||||
Straight-line rent (adjustment) income | ( | | ( | (4) | ( | (4) | |||||||
Adjustment of lease incentives and rental income | ( | (5) | — | ( | (6) | ( | (7) | ||||||
Amortization of lease incentives | ( | ( | ( | ( | |||||||||
Total | $ | | $ | | $ | | $ | | |||||
| (1) | Decreased primarily due to the conversion of |
| (2) | Decreased primarily due to (1) above and the turnaround impact of one-time revenue received in 2024 related to the repayment of $ |
| (3) | The variable rental income includes reimbursement of real estate taxes by our lessees. Decrease primarily due to conversion of |
| (4) | Straight-line rental income decreased primarily due to scheduled annual escalations partially offset by lease extensions. |
| (5) | In connection with Genesis’ on-going Chapter 11 bankruptcy filing, we wrote-off the Genesis straight-line rent receivable balance of $ |
| (6) | Relates to explanation (5) above and the write-off of a straight-line rent receivable of $ |
| (7) | Represents a lease incentive balance write-off as a result of converting a lease to fair-market rent resets. |
13
LTC PROPERTIES, INC.
NOTES TO CONSOLIDATED FINANCIAL STATEMENTS CONTINUED
(Unaudited)
Some of our lease agreements provide purchase options allowing the lessees to purchase the properties they currently lease from us. The following table summarizes information about purchase options included in our lease agreements (dollar amounts in thousands):
Type | Number | ||||||||||||
Option | of | of | Gross | Net Book | |||||||||
Window | State | Property | Properties | Investments (1) | Value | ||||||||
2024-2028 | (2) | North Carolina | SH | $ | | $ | | ||||||
2024-2028 | (2) | North Carolina/ South Carolina | SH | | | ||||||||
2025 | (3) | Tennessee | SNF | | | ||||||||
2025-2027 | (4) | Florida | SNF | | | ||||||||
2025-2029 | (5) | North Carolina | SH | | | ||||||||
2026 | South Carolina | SH | | | |||||||||
2027 | Georgia/South Carolina | SH | | | |||||||||
2027-2029 | (6) | Oklahoma | SH | | | ||||||||
2027-2029 | (7) | Texas | SNF | | | ||||||||
2029 | Colorado/Kansas/Ohio/Texas | SH | | | |||||||||
2029 | North Carolina | SH | | | |||||||||
Total | $ | | $ | |
| (1) | Gross investments include previously recorded impairment losses, if any. |
| (2) | The purchase option can be exercised through 2028, with an exit Internal Rate of Return (“IRR”) of |
| (3) | The purchase option window which expired on December 31, 2024, was extended for another year to December 31, 2025. During the third quarter of 2025, the operator provided an election notice to exercise its purchase option. |
| (4) | These assets are accounted for as financing receivables. For more information see Financing Receivables below. Subsequent to September 30, 2025, the operator provided notice of its intent to exercise its purchase option. |
| (5) | The operator has the option to buy the properties in multiple tranches and in serial closings approved by LTC with an exit IRR of |
| (6) | The purchase option can be exercised starting in November 2027 through October 2029 if the lessee exercises its |
| (7) | The operator may elect to either receive an earn-out payment or exercise its purchase option. If neither option is elected within the timeframe defined in the lease, both elections are terminated. For more information regarding the earn-out see Note 12. Commitments and Contingencies. |
Properties Held -for-Sale.
Type | Number | Number | |||||||||||||
of | of | of | Gross | Accumulated | |||||||||||
State | Property | Properties | Beds/units | Investment | Depreciation | ||||||||||
At September 30, 2025 | CA/FL/VA | SNF | (1) | | | $ | | $ | ( | ||||||
At December 31, 2024 | OK | SH | (2) | | | $ | | $ | ( |
| (1) | These centers were sold subsequent to September 30, 2025. See footnote (2) to the Properties Sold table below for additional information. |
| (2) | This community was sold during the first quarter of 2025. Upon sale, the community was removed from a master lease covering |
14
LTC PROPERTIES, INC.
NOTES TO CONSOLIDATED FINANCIAL STATEMENTS CONTINUED
(Unaudited)
Acquisitions. The following table summarizes our acquisitions within our Triple-Net segment for the nine months ended September 30, 2025 and 2024 (dollar amounts in thousands):
Total | Number | Number | |||||||||||||
Purchase | Transaction | Acquisition | of | of | |||||||||||
Year | Type of Property | Price | Costs | Costs | Properties | Beds/Units | |||||||||
2025 | n/a | $ | — | $ | — | $ | — | n/a | n/a | ||||||
2024 | OTH (1) | | | | — | — | |||||||||
| (1) | During the nine months ended September 30, 2024, we acquired a parcel of land in Kansas adjacent to an existing community operated by Brookdale. Rent was increased by |
Properties Sold. During the nine months ended September 30, 2025 we recognized a net loss on sale of real estate of $
Type | Number | Number | ||||||||||||||||
of | of | of | Sales | Carrying | Net | |||||||||||||
Year | State | Properties | Properties | Beds/Units | Price | Value | (Loss) Gain (1) | |||||||||||
2025 | (2) | Ohio | SH | | | $ | | $ | | $ | | |||||||
Ohio (3) | n/a | — | — | | | | ||||||||||||
Oklahoma | SH | | | | | ( | ||||||||||||
Texas | n/a | | — | | | ( | ||||||||||||
Total | | | $ | | $ | | $ | ( | ||||||||||
2024 | Florida | SH | | | $ | | $ | | $ | ( | ||||||||
Texas | SH | | | | | ( | ||||||||||||
Texas | SH | | — | | | — | ||||||||||||
Texas | SH | | | | | | ||||||||||||
Wisconsin | SH | | | | (4) | | (4) | | ||||||||||
n/a | n/a | — | — | — | — | ( | (5) | |||||||||||
Total | | | $ | | $ | | $ | |
(
| (1) | Calculation of net (loss) gain includes cost of sales and write-off of straight-line receivable and lease incentives, when applicable. |
| (2) | Subsequent to September 30, 2025, we sold |
| (3) | We sold a parcel of land adjacent to a memory care community within our portfolio. |
| (4) | Represents the price to sell our portion of interest in a JV, net of the JV partner’s $ |
| (5) | We recognized additional loss due to additional incurred costs related to properties sold during 2023. |
15
LTC PROPERTIES, INC.
NOTES TO CONSOLIDATED FINANCIAL STATEMENTS CONTINUED
(Unaudited)
Owned Properties-SHOP
As discussed above, during the second quarter of 2025, we terminated the Anthem and New Perspective Triple-Net master leases and converted the communities covered under the master leases into our new SHOP segment. Additionally, during the third quarter of 2025, we acquired
The following table summarizes acquisitions within our SHOP segment during the nine months ended September 30, 2025 (dollar amounts in thousands):
Total | Number | Number |
| |||||||||||||
Purchase | Transaction | Acquisition | of | of |
| |||||||||||
Type of Property | State | Price | Costs | Costs | Properties | Beds/Units |
| |||||||||
SH | CA | $ | | $ | | $ | | |||||||||
SH | KY | | | | ||||||||||||
SH | WI | | | | ||||||||||||
$ | | (1) | $ | | $ | | (2) | |||||||||
| (1) | Subsequent to September 30, 2025, we acquired an |
| (2) | Includes $ |
The following table presents the total acquisition costs allocated to assets acquired (in thousands):
Amount | |||
Land | $ | | |
Buildings and improvements | | ||
Total acquisition costs | $ | | |
The following table provides information regarding our SHOP segment as of September 30, 2025 (dollar amounts in thousands):
Average | ||||||||||
Number | Number | Investment | ||||||||
Gross | of | of | per | |||||||
State | Investment | Properties | Beds/Units | Unit | ||||||
Wisconsin | $ | | | | $ | |||||
Illinois | | | | $ | ||||||
California | | | | $ | ||||||
Colorado | | | | $ | ||||||
Kentucky | | | | $ | ||||||
Kansas | | | | $ | ||||||
Ohio | | | | $ | ||||||
Total | $ | | (1) | | | $ | ||||
| (1) | Subsequent to September 30, 2025, we acquired within our SHOP segment an |
16
LTC PROPERTIES, INC.
NOTES TO CONSOLIDATED FINANCIAL STATEMENTS CONTINUED
(Unaudited)
Financing Receivables
As part of our acquisitions, we may invest in sale and leaseback transactions. In accordance with the accounting guidance, we must determine whether each sale and leaseback transaction qualifies as a sale. Generally, an option for the seller-lessee to repurchase a real estate asset precludes accounting for the transfer of the asset as a sale and the purchased assets should be presented as financing receivables.
We have entered into joint venture agreements and contributed into these JVs for the purchase of properties through sale and leaseback transactions. Concurrently, each of these JVs leased the purchased properties back to an affiliate of the seller and provided the seller-lessee with purchase options. Accordingly, these sale and leaseback transactions meet the accounting criteria to be presented as financing receivables. Furthermore, we determined that we exercise power over and receive benefits from each of these joint ventures. Therefore, we consolidated the joint ventures as Financing Receivables on our Consolidated Balance Sheets and recorded the rental revenue from these joint ventures as Interest income from financing receivables on our Consolidated Statements of Income.
The following tables provide information regarding our investments in financing receivables at September 30, 2025 (dollar amounts in thousands):
Type | Number | Number | Investment | ||||||||||||||||||
Interest | Investment | Gross | LTC | of | of | of | per | ||||||||||||||
Rate | Year | Maturity | State | Investments | Investment | Properties | Properties | Beds/Units | Bed/Unit | ||||||||||||
(1) | 2022 | 2032 | FL | $ | | $ | | SNF | $ | | |||||||||||
(2) | 2023 | 2033 | NC | | | SH | $ | | |||||||||||||
(3) | 2024 | 2034 | NC/SC | | | SH | $ | | |||||||||||||
(4) | 2024 | 2034 | NC | | | SH | $ | | |||||||||||||
Total | $ | | $ | | |
| (1) | A purchase option available to the seller-lessee is exercisable at the beginning of the fourth lease year (2025) through the end of the fifth lease year (2027), with an exit IRR of |
| (2) | The seller-lessee has the option to buy the properties in multiple tranches and in serial closings approved by LTC with an exit IRR of |
| (3) | During the second quarter of 2024, we funded an additional $ |
| (4) | During the second quarter of 2024, we funded an additional $ |
17
LTC PROPERTIES, INC.
NOTES TO CONSOLIDATED FINANCIAL STATEMENTS CONTINUED
(Unaudited)
Mortgage Loans
The following table sets forth information regarding our investments in mortgage loans secured by first mortgages at September 30, 2025 (dollar amounts in thousands):
Type | Percentage | Number of | Investment | ||||||||||||||||||||
Gross | of | of | SNF | SH | per |
| |||||||||||||||||
Interest Rate | Maturity | State | Investment | Property | Investment | Loans (2) | Properties (3) | Beds | Units | Bed/Unit |
| ||||||||||||
2025 | FL | $ | | SH | | % | | | — | | $ | | |||||||||||
2026 | NC | | SH | | % | | | — | | $ | | ||||||||||||
2026 | MI | | SH | | % | | | — | | $ | | ||||||||||||
(4) | 2030 | IL | | UDP | | % | | — | — | — | $ | — | |||||||||||
2030 | FL | | SH | | % | | | — | | $ | | ||||||||||||
2030 | CA | | SH | | % | | | — | | $ | | ||||||||||||
(5) | 2043 | MI | | SNF | | % | | | | — | $ | | |||||||||||
(6) | 2045 | MI | | SNF | | % | | | |
| — | $ | | ||||||||||
(6) | 2045 | MI |
| | SNF | | % | | | |
| — | $ | | |||||||||
(6) | 2045 | MI | | SNF | | % | | | | — | $ | | |||||||||||
Total | $ | | (1) | | % | | | |
| | $ | | |||||||||||
| (1) | Excludes the impact of the credit loss reserve. |
| (2) | Some loans contain certain guarantees and provide for certain facility fees. |
| (3) | Our mortgage loans are secured by properties located in |
| (4) | During 2024, we committed to fund a $ |
| (5) | During the three months ended September 30, 2025, we modified the mortgage loan with Prestige Healthcare (“Prestige”), the borrower, to increase the current interest paid by the borrower from |
| (6) | Mortgage loans provide for |
18
LTC PROPERTIES, INC.
NOTES TO CONSOLIDATED FINANCIAL STATEMENTS CONTINUED
(Unaudited)
As noted in the table above, we modified the Prestige $
The following table summarizes our mortgage loan activity for the nine months ended September 30, 2025 and 2024 (in thousands):
Nine Months Ended September 30, | |||||||
2025 | 2024 | ||||||
Originations and funding under mortgage loans receivable | $ | | (1) | $ | | (2) | |
Exchange of mortgage loans for controlling interests in joint ventures accounted for as financing receivables | — | ( | (3) | ||||
Pay-offs received | ( | ( | |||||
Application of interest reserve | — | | |||||
Scheduled principal payments received | ( | ( | |||||
Mortgage loan premium amortization | ( | ( | |||||
(Provision) recovery for loan loss reserve | ( | | |||||
Net increase (decrease) in mortgage loans receivable | $ | | $ | ( | |||
| (1) | Includes the following: |
| (a) | $ |
| (b) | $ |
| (c) | $ |
| (d) | $ |
| (2) | Includes the following: |
| (a) | $ |
| (b) | $ |
| (c) | $ |
| (d) | $ |
| (3) | Includes the following: |
| (a) | $ |
| (b) | $ |
19
LTC PROPERTIES, INC.
NOTES TO CONSOLIDATED FINANCIAL STATEMENTS CONTINUED
(Unaudited)
4. | Investment in Unconsolidated Joint Ventures |
We have a preferred equity investments in one joint venture and an acquisition, development and construction (“ADC”) loan. We determined that each of these JVs meet the accounting criteria to be considered a variable interest entity (“VIE”). We are not the primary beneficiary of the JVs as we do not have both: 1) the power to direct the activities that most significantly affect the JVs’ economic performance, and 2) the right to receive benefits from the VIE or the obligation to absorb losses of the VIE that could be significant to the VIE. However, we do have significant influence over the JVs. Therefore, we have accounted for the JVs using the equity method of accounting. During 2025, we received $
Type | Type | Total | Contractual | Number | ||||||||||||
of | of | Preferred | Cash | of | Carrying | |||||||||||
State | Properties | Investment | Return | Portion | Beds/ Units | Value | ||||||||||
Texas | SNF | Senior Loan | (1) | % | % | $ | | (1) | ||||||||
Washington | SH | Preferred Equity | (2) | % | % | | | (2) | ||||||||
Total | | $ | |
| (1) | Represents a $ |
| (2) | Our investment represents |
The following table summarizes our capital contributions, income recognized, and cash interest received related to our investments in unconsolidated joint ventures during the nine months ended September 30, 2025 and 2024 (in thousands):
Type | ||||||||||||
of | Income | Cash Income | Non-cash | |||||||||
Year | Properties | Recognized | Earned | Income Accrued | ||||||||
2025 | SNF | $ | | $ | | $ | — | |||||
SH | | | — | |||||||||
SH (1) | | (1) | | (1) | | |||||||
Total | $ | | $ | | $ | | ||||||
2024 | SNF | $ | $ | $ | — | |||||||
SH | | | — | |||||||||
SH (1) | | — | | |||||||||
Total | $ | | $ | | $ | |
| (1) | During 2025, our preferred equity investment in a JV that owns a |
20
LTC PROPERTIES, INC.
NOTES TO CONSOLIDATED FINANCIAL STATEMENTS CONTINUED
(Unaudited)
5. | Notes Receivable |
Notes receivable consist of working capital loans and a mezzanine loan. The following table summarizes our investments in notes receivable at September 30, 2025 (dollar amounts in thousands):
Interest | Type of | Gross | Type of | |||||||||||||
Rate | IRR | Maturity | Loan | Investment | # of loans | Property | ||||||||||
— | 2026 | Working capital | $ | | SH | |||||||||||
% | 2027 | Mezzanine | | SH | ||||||||||||
— | 2028 | Working capital | | SNF | ||||||||||||
— | 2030 | Working capital | | SH | ||||||||||||
$ | | (1) | ||||||||||||||
| (1) | Excludes the impact of credit loss reserve. |
The following table is a summary of our notes receivable components as of September 30, 2025 and December 31, 2024 (in thousands):
At September 30, 2025 | At December 31, 2024 |
| ||||
Mezzanine loans | $ | | $ | | ||
Working capital loans | | | ||||
Notes receivable credit loss reserve | ( | ( | ||||
Total notes receivable, net of credit loss reserve | $ | | $ | | ||
The following table summarizes our notes receivable activity for the nine months ended September 30, 2025 and 2024 (in thousands):
Nine Months Ended September 30, | ||||||
2025 | 2024 | |||||
Advances under notes receivable | $ | | $ | | ||
Principal payments received under notes receivable | ( | (1) | ( | (3) | ||
Write-off of notes receivable | ( | (2) | — | |||
Recovery of credit losses | | | ||||
Net decrease in notes receivable | $ | ( | $ | ( | ||
| (1) | Includes the following: |
| (a) | $ |
| (b) | $ |
| (c) | $ |
| (2) | Represents the write-off of Anthem Memory Care LLC (“Anthem”) working capital note in connection with the conversion of Anthem’s Triple-Net leases to SHOP. |
| (3) | During 2024, we received $ |
21
LTC PROPERTIES, INC.
NOTES TO CONSOLIDATED FINANCIAL STATEMENTS CONTINUED
(Unaudited)
6. | Lease Incentives |
Our non-contingent lease incentive balances at September 30, 2025 and December 31, 2024 were $
Nine Months Ended September 30, | ||||||||
2025 | 2024 |
| ||||||
Lease incentives funded | $ | — | $ | | ||||
Amortization of lease incentives | ( | ( | ||||||
Adjustment for collectability of lease incentives | ( | (1) | — | |||||
Other adjustments | — | ( | (2) | |||||
Net (decrease) increase in non-contingent lease incentives | $ | ( | $ | |
| |||
| (1) | Represents uncollectible lease incentive balances written-off due to the termination of |
| (2) | Represents lease incentive balances written-off due to property sales. |
Non-contingent lease incentives represent payments made to our lessees for various reasons including entering into a new lease or lease amendments and extensions. Contingent lease incentives represent potential contingent earn-out payments that may be made to our lessees in the future, as part of our lease agreements. From time to time, we may commit to provide contingent payments to our lessees, upon our properties achieving certain rent coverage ratios. Once the contingent payment becomes probable and estimable, the contingent payment is recorded as a lease incentive. Lease incentives are amortized as a yield adjustment to rental income over the remaining life of the lease.
7. | Credit Loss Reserve |
We apply ASC Topic 326, Financial Instruments-Credit Losses (“ASC 326”), which requires a forward-looking “expected loss” model, to estimate our loan losses. We determined our Financing receivables, Mortgage loans receivable and Notes receivable line items on our Consolidated Balance Sheets are within the scope of ASC 326.
Financing receivables. We obtained controlling interests in JVs that acquired properties through sale and leaseback transactions. The JVs concurrently leased the purchased properties to affiliates of sellers and provided the sellers-lessees with purchase options. We consolidated the JVs as Financing receivables on our Consolidated Balance Sheets. For more information regarding these transactions See Note 3. Real Estate Investments above. At September 30, 2025, we had investments in
Mortgage loans. As part of our strategy of making investments in properties used in the provision of long-term health care services, we provided mortgage loan financing on such properties. At September 30, 2025, we had
22
LTC PROPERTIES, INC.
NOTES TO CONSOLIDATED FINANCIAL STATEMENTS CONTINUED
(Unaudited)
Notes receivable. Our notes receivable consist of working capital notes and a mezzanine loan. Security for these notes can include all or a portion of the following credit enhancements: secured second mortgage, pledge of equity interests and personal/corporate guarantees.
The following table summarizes our financial instruments within the scope of ASC 326 by year of origination (dollar amounts in thousands):
Year of origination (1) | At September 30, 2025 | |||||||||||||||||||||||
Investment Type: | 2025 | 2024 | 2023 | 2022 | 2021 | Prior | Total | Credit loss reserve | ||||||||||||||||
Financing receivables | $ | — | $ | | $ | | $ | | $ | — | $ | — | $ | | $ | | ||||||||
Mortgage loans receivable | $ | | $ | | $ | | $ | — | $ | | $ | | $ | | $ | | ||||||||
Mezzanine loans | $ | — | $ | — | $ | — | $ | | $ | — | $ | — | $ | | $ | | ||||||||
Working Capital loans | — | | — | — | | | | | ||||||||||||||||
Total Notes Receivable | $ | — | $ | | $ | — | $ | | $ | | $ | | $ | | $ | | ||||||||
| (1) | Excludes paid-off loans. Additional funding, if any, is included in the year of the origination of the initial loan. |
We monitor the credit quality of our financial instruments through a variety of methods determined by the underlying collateral or other protective rights, operator’s payment history and other internal metrics. Our monitoring process includes periodic review of financial statements for each facility, scheduled property inspections and review of covenant compliance, industry conditions and current and future economic conditions. The future economic conditions are based on the economic data from the Federal Reserve and reasonable assumptions for the future economic trends.
In determining the “expected” credit loss reserves on these instruments, we utilize the probability of default and discounted cash flow methods. Further, we stress-test the results to reflect the impact of unknown adverse future events including recessions.
The expected credit losses related to our financial instruments that are within the scope of ASC 326 are as follows (in thousands):
| Recovery |
| Provision |
| |||||||||
| Balance | due to |
| due to |
| Balance | |||||||
| at | Payoffs/ |
| Originations/ |
| at | |||||||
Description |
| 12/31/2024 | Write-offs |
| additional funding |
| 9/30/2025 | ||||||
Credit Loss Reserve- Financing Receivables |
| $ | | $ | — |
| $ | |
| $ | | ||
Credit Loss Reserve- Mortgage Loans Receivable | | ( | | | |||||||||
Credit Loss Reserve-Notes Receivable |
| | ( |
| — |
| | ||||||
We elected not to measure an allowance for expected credit losses on accrued interest receivable under the expected credit loss standard as we have a policy in place to reserve or write off accrued interest receivable in a timely manner through our quarterly review of the loan and property performance. Therefore, we elected the policy to write off accrued interest receivable by recognizing credit loss expense. As of September 30, 2025, the total balance of accrued interest receivable of $
23
LTC PROPERTIES, INC.
NOTES TO CONSOLIDATED FINANCIAL STATEMENTS CONTINUED
(Unaudited)
8. | Prepaid Expenses and Other Assets |
The following is a summary of our prepaid expenses and other assets at September 30, 2025 and December 31, 2024 (dollar amounts in thousands):
September 30, 2025 | December 31, 2024 | |||||
Intangible assets | $ | | $ | | ||
SHOP prepaid expenses and other assets | | — | ||||
Real estate investments, prepaid expenses and other assets | | | ||||
Right of use asset, net | | | ||||
Interest rate swap asset | | | ||||
SHOP accounts receivable, net of credit loss reserve: 2025— $ | | — | ||||
Deferred income tax asset | | — | ||||
Total | $ | | $ | | ||
9. | Debt Obligations |
Unsecured Credit Facility. Through the first quarter of 2024, we had an unsecured credit agreement (the “Original Credit Agreement”) that provided for an aggregate commitment of the lenders of up to $
During the first quarter of 2024, we entered into an amendment to the Original Credit Agreement (the “Credit Agreement”) to accelerate our
During the third quarter of 2025, we entered into a new unsecured credit agreement (the “New Credit Agreement”) maturing in July 2029, to replace our previous Credit Agreement. The New Credit Agreement increased the aggregate commitment on our revolving line of credit from $
24
LTC PROPERTIES, INC.
NOTES TO CONSOLIDATED FINANCIAL STATEMENTS CONTINUED
(Unaudited)
Interest Rate Swap Agreements. In connection with entering into the Term Loans described above, we entered into
Information regarding our Interest Rate Swaps measured at fair value, which are classified as Level 2 of the fair value hierarchy is presented below (dollar amounts in thousands):
Notional | Fair Value at | |||||||||||||||||
Date Entered | Maturity Date | Swap Rate | Rate Index | Amount | September 30, 2025 | December 31, 2024 | ||||||||||||
November 2021 | November 19, 2025 | % | 1-month SOFR | $ | $ | | $ | | ||||||||||
November 2021 | November 19, 2026 | % | 1-month SOFR | | | |||||||||||||
$ | $ | | $ | | ||||||||||||||
Senior Unsecured Notes. We have senior unsecured notes held by institutional investors with interest rates ranging from
The senior unsecured notes and the Credit Agreement, contain financial covenants, which are measured quarterly, that require us to maintain, among other things:
| ● | a ratio of total indebtedness to total asset value not greater than |
| ● | a ratio of secured debt to total asset value not greater than |
| ● | a ratio of unsecured debt to the value of the unencumbered asset value not greater than |
| ● | a ratio of EBITDA, as calculated in the debt obligation, to fixed charges not less than |
At September 30, 2025, we were in compliance with all applicable financial covenants. These debt obligations also contain additional customary covenants and events of default that are subject to a number of important and significant limitations, qualifications and exceptions.
25
LTC PROPERTIES, INC.
NOTES TO CONSOLIDATED FINANCIAL STATEMENTS CONTINUED
(Unaudited)
The following table sets forth information regarding debt obligations by component as of September 30, 2025 and December 31, 2024 (dollar amounts in thousands):
At September 30, 2025 | At December 31, 2024 | ||||||||||||||
Applicable | Available | Available | |||||||||||||
Interest | Outstanding | for | Outstanding | for | |||||||||||
Debt Obligations | Rate (1) | Balance | Borrowing | Balance | Borrowing | ||||||||||
Revolving line of credit (2) | $ | | $ | | $ | | $ | | |||||||
Term loans, net of debt issue costs | n/a | — | — | | — | ||||||||||
Senior unsecured notes, net of debt issue costs | | — | | — | |||||||||||
Total | $ | | $ | | $ | | $ | | |||||||
| (1) | Represents weighted average interest rate as of September 30, 2025. |
| (2) | Subsequent to September 30, 2025, we repaid $ |
During the nine months ended September 30, 2025 and 2024, our debt borrowings and repayments were as follows (in thousands):
Nine Months Ended September 30, | |||||||||||||
2025 | 2024 | ||||||||||||
Debt Obligations | Borrowings | Repayments | Borrowings | Repayments | |||||||||
Revolving line of credit | $ | | $ | ( | (1) | $ | | $ | ( | ||||
Term loans | — | ( | — | — | |||||||||
Senior unsecured notes | — | ( | — | ( | |||||||||
Total | $ | | $ | ( | $ | | $ | ( | |||||
| (1) | Subsequent to September 30, 2025, we repaid $ |
| 10. | Accrued Expenses and Other Liabilities |
The following is a summary of our accrued expenses and other liabilities (dollar amounts in thousands):
September 30, 2025 | December 31, 2024 | |||||
Impounds | $ | | $ | | ||
Security deposits | | | ||||
Property tax liability | | | ||||
Maintenance and repair reserves | | | ||||
Accounts payable and other accrued liabilities | | | ||||
SHOP liabilities | | — | ||||
Deferred commitments | | | ||||
Lease liabilities | | | ||||
SHOP deferred revenue | | — | ||||
$ | | $ | | |||
| 11. |
26
LTC PROPERTIES, INC.
NOTES TO CONSOLIDATED FINANCIAL STATEMENTS CONTINUED
(Unaudited)
11. | Equity |
Non-controlling Interests. We have entered into partnerships to develop and/or own real estate. Given that our limited members do not have the substantive kick-out rights, liquidation rights, or participation rights, we have concluded that the partnerships are VIEs. As we exercise power over and receive benefits from the VIEs, we are considered the primary beneficiary. Accordingly, we consolidate the VIEs and record the non-controlling interests on the consolidated financial statements.
As of September 30, 2025, we have the following consolidated VIEs (in thousands):
Gross | |||||||||||||
Investment | Property | Consolidated | Non-Controlling | ||||||||||
Year | Purpose | Type | State | Assets | Interests | ||||||||
2024 | Own real estate | SH | NC/SC | $ | | $ | | ||||||
2024 | Own real estate | SH | NC | | | ||||||||
2023 | Own real estate | SH | OH | | | ||||||||
2023 | Own real estate | SH | NC | | | ||||||||
2022 | Own real estate | SNF | FL | | | ||||||||
Total | $ | | $ | |
| (1) | Includes the total real estate investments and excludes intangible assets. |
During the nine months ended September 30, 2025, we acquired our JV partner’s non-controlling interest in a JV that owns
Common Stock. We had separate equity distribution agreements (collectively, the “Original Equity Distribution Agreements”) to offer and sell, from time to time, up to $
27
LTC PROPERTIES, INC.
NOTES TO CONSOLIDATED FINANCIAL STATEMENTS CONTINUED
(Unaudited)
During the nine months ended September 30, 2025, we sold
During the nine months ended September 30, 2024, we sold
During the nine months ended September 30, 2025 and 2024, we acquired
Available Shelf Registration. We have an automatic shelf registration statement on file with the SEC, and currently have the ability to file additional automatic shelf registration statements, to provide us with capacity to publicly offer an indeterminate amount of common stock, preferred stock, warrants, debt, depositary shares, or units. We may from time to time raise capital under our automatic shelf registration statement in amounts, at prices, and on terms to be announced when and if the securities are offered. The specifics of any future offerings, along with the use of proceeds of any securities offered, will be described in detail in a prospectus supplement, or other offering materials, at the time of the offering. Our shelf registration statement expires in November 2027.
Distributions.
Nine Months Ended September 30, | ||||||||||||
2025 | 2024 | |||||||||||
Declared | Paid | Declared | Paid | |||||||||
Common Stock (1) | $ | | (2) | $ | | (2) | $ | | $ | | ||
| (1) | Represents $ |
| (2) | Includes $ |
In October 2025, we declared a monthly cash dividend of $
Stock-Based Compensation. During 2021, we adopted and our shareholders approved the 2021 Equity Participation Plan (“the 2021 Plan”) which replaces the 2015 Equity Participation Plan (“the 2015 Plan”). Under the 2021 Plan,
28
LTC PROPERTIES, INC.
NOTES TO CONSOLIDATED FINANCIAL STATEMENTS CONTINUED
(Unaudited)
terms of the awards granted under the 2021 Plan and the 2015 Plan are set by our compensation committee at its discretion. Beginning in the first quarter of 2024, we entered into Performance Stock Unit Award Agreements, based upon absolute and relative total shareholder return, under the 2021 Plan.
During the nine months ended September 30, 2025 and 2024,
The following table summarizes our restricted stock activity for the nine months ended September 30, 2025 and 2024:
Nine Months Ended September 30, | ||||||||||||
Shares | Weighted Average Price | |||||||||||
2025 | 2024 |
| 2025 | 2024 | ||||||||
Outstanding, January 1 | | | $ | $ | ||||||||
Granted | | | $ | $ | ||||||||
Vested | ( | (1) | ( | $ | $ | |||||||
Outstanding, September 30 | | | $ | $ | ||||||||
| (1) | Includes the accelerated vesting of |
During the nine months ended September 30, 2025,
During the nine months ended September 30, 2025 and 2024, we granted restricted stock and performance-based stock units under the 2021 Plan as follows:
No. of | Price per | |||||||||
Year | Shares/Units | Share | Reward Type | Vesting Period | ||||||
2025 | $ | Restricted stock | ratably over | |||||||
$ | Restricted stock | April 30, 2028 | ||||||||
$ | Restricted stock | (1) | ||||||||
| $ | | Performance-based stock units | TSR targets (2) | ||||||
| $ | | Performance-based stock units | TSR targets (3) | ||||||
2024 | $ | Restricted stock | ratably over | |||||||
| $ | | Performance-based stock units | TSR targets (2) | ||||||
| $ | | Performance-based stock units | TSR targets (3) | ||||||
| $ | | Restricted stock | (1) | ||||||
| (1) | Vesting date is the earlier of the one-year anniversary of the award date and the date of the next annual meeting of the stockholders of LTC following the award date. |
| (2) | Vesting is based on achieving certain total shareholder return (“TSR”) targets in |
| (3) | Vesting is based on achieving certain TSR targets relative to the TSR of a predefined peer group in |
29
LTC PROPERTIES, INC.
NOTES TO CONSOLIDATED FINANCIAL STATEMENTS CONTINUED
(Unaudited)
Compensation expense recognized related to the vesting of restricted common stock and performance-based stock units for the nine months ended September 30, 2024 was $
Remaining | |||
Compensation | |||
Vesting Date | Expense | ||
October-December 2025 | $ | | |
2026 | | ||
2027 | | ||
2028 | | ||
Total | $ | | |
12. | Commitments and Contingencies |
At September 30, 2025, we had commitments as follows (in thousands):
Total | ||||||||||||
Investment | 2025 | Commitment | Remaining | |||||||||
Commitment | Funding | Funded | Commitment | |||||||||
Triple-Net properties | $ | | (1) | $ | | $ | | $ | | |||
SHOP properties | | | | | ||||||||
Subtotal: owned real estate properties (Note 3. Real Estate Investments) | | | | | ||||||||
Financing receivables (Note 3.Real Estate Investments) | | | | | ||||||||
Accrued incentives and earn-out liabilities (Note 6. Lease Incentives) | | (2) | — | — | | |||||||
Mortgage loans (Note 3. Real Estate Investments) | | (3) | | | | |||||||
Joint venture investments (Note 4. Investments in Unconsolidated Joint Ventures) | | (4) | | | | |||||||
Notes receivable (Note 5. Notes Receivable) | | (5) | | | | |||||||
Total | $ | | $ | | $ | | $ | | ||||
| (1) | Represents commitments to purchase land and improvements, if applicable, and to develop, re-develop, renovate or expand seniors housing and skilled nursing properties. |
| (2) | Includes an earn-out payment of up to $ |
| (3) | Represents $ |
| (4) | Represents expenditure reserve of $ |
| (5) | Represents working capital loan commitments. |
Additionally, some of our lease agreements provide purchase options allowing the lessee to purchase the properties they currently lease from us. See Note 3. Real Estate Investments for a table summarizing information about our purchase options.
30
LTC PROPERTIES, INC.
NOTES TO CONSOLIDATED FINANCIAL STATEMENTS CONTINUED
(Unaudited)
We are a party from time to time to various general and professional liability claims and lawsuits asserted against the lessees or borrowers of our properties, which in our opinion are not singularly or in the aggregate material to our results of operations or financial condition. These types of claims and lawsuits may include matters involving general or professional liability, which we believe under applicable legal principles are not our responsibility as a non-possessory landlord or mortgage holder. We believe that these matters are the responsibility of our lessees and borrowers pursuant to general legal principles and pursuant to insurance and indemnification provisions in the applicable leases or mortgages. We intend to continue to vigorously defend such claims.
13. | Major Operators |
Within our real estate investment segment,
Number of | Number of | Percentage of | |||||||||||||
SNF | SH | Total | Total | ||||||||||||
Operator | SNF | SH | Beds | Units | Revenues (1) | Assets (2) | |||||||||
Prestige Healthcare (3) | | — | | | | % | | % | |||||||
ALG Senior Living(4) | — | | — | | | % | | % | |||||||
Total | | | | | % | % | |||||||||
| (1) | Includes total revenues for the nine months ended September 30, 2025. |
| (2) | Represents the net carrying value of the mortgage loans and properties we own divided by the Total assets on the Consolidated Balance Sheets. |
| (3) | The majority of the revenue derived from this operator relates to interest income from mortgage loans. |
| (4) | The majority of the revenue derived from this operator relates to interest income from financing receivables. |
Our financial position and ability to make distributions may be adversely affected if Prestige Healthcare, ALG Senior Living or any of our lessees and borrowers face financial difficulties, including any bankruptcies, inability to emerge from bankruptcy, insolvency or general downturn in business of any such operator, or in the event any such operator does not renew and/or extend its relationship with us.
31
LTC PROPERTIES, INC.
NOTES TO CONSOLIDATED FINANCIAL STATEMENTS CONTINUED
(Unaudited)
14. | Earnings per Share |
The following table sets forth the computation of basic and diluted net income per share (in thousands, except per share amounts):
Three Months Ended | Nine Months Ended | ||||||||||||
September 30, | September 30, | ||||||||||||
2025 | 2024 | 2025 | 2024 | ||||||||||
Net (loss) income | $ | ( | $ | | $ | | $ | | |||||
Less income allocated to non-controlling interests |
| ( |
| ( |
| ( |
| ( | |||||
Less income allocated to participating securities: | |||||||||||||
Non-forfeitable dividends on participating securities | ( | ( | ( | ( | |||||||||
Income allocated to participating securities | — | ( | (1) | — | — | (1) | |||||||
Total net income allocated to participating securities | ( | ( | ( | ( | |||||||||
Net (loss) income available to common stockholders | ( | | | | |||||||||
Effect of dilutive securities: | |||||||||||||
Participating securities (2) | — | — | — | — | |||||||||
Net (loss) income for diluted net income per share | $ | ( | $ | | $ | | $ | | |||||
Shares for basic net income per share | | | | | |||||||||
Effect of dilutive securities: | |||||||||||||
Performance-based stock units | — | (3) | | | | ||||||||
Participating securities (2) | — | — | — | — | |||||||||
Total effect of dilutive securities | — | | | | |||||||||
Shares for diluted net income per share | | | | | |||||||||
Basic net income per share | $ | ( | $ | | $ | | $ | | |||||
Diluted net income per share | $ | ( | $ | | $ | | $ | | |||||
| (1) | The computation of the net income per share for the three and nine months ended September 30, 2024 are made independently. Therefore, the sum of the quarters may not agree with the amounts for the year-to-date periods. |
| (2) | For the three and nine months ended September 30, 2025 and 2024, the participating securities were excluded from the computation of diluted net income per share as such inclusion would be anti-dilutive. |
| (3) | For the three months ended September 30, 2025, the performance-based stock units were excluded from the calculation of the shares for diluted net income per share as such inclusion would be anti-dilutive. |
15. | Fair Value Measurements |
In accordance with the accounting guidance regarding the fair value option for financial assets and financial liabilities, entities are permitted to choose to measure certain financial assets and liabilities at fair value, with the change in unrealized gains and losses reported in earnings. We did not elect the fair value option for any of our financial assets and financial liabilities.
32
LTC PROPERTIES, INC.
NOTES TO CONSOLIDATED FINANCIAL STATEMENTS CONTINUED
(Unaudited)
The carrying amount of cash and cash equivalents approximates their fair value because of the short-term maturity of these instruments. We do not invest our cash in auction rate securities.
At September 30, 2025 | At December 31, 2024 | ||||||||||||
Carrying | Fair | Carrying | Fair | ||||||||||
Value | Value | Value | Value | ||||||||||
Financing receivables, net of credit loss reserve | $ | | $ | | (1) | $ | | $ | | (1) | |||
Mortgage loans receivable, net of credit loss reserve | | | (2) | | | (2) | |||||||
Notes receivable, net of credit loss reserve |
| |
| | (3) |
| |
| | (3) | |||
Revolving line of credit |
| | | (4) | | | (4) | ||||||
Term loans, net of debt issue costs | — | — | (4) | | | (4) | |||||||
Senior unsecured notes, net of debt issue costs |
| | | (5) | | | (5) | ||||||
| (1) | Our investment in financing receivables is classified as Level 3. The fair value is determined using a widely accepted valuation technique, discounted cash flow analysis on the expected cash flows. The discount rate used to value our future cash inflows of the financing receivables at September 30, 2025 and December 31, 2024 was |
| (2) | Our investment in mortgage loans receivable is classified as Level 3. The fair value is determined using a widely accepted valuation technique, discounted cash flow analysis on the expected cash flows. The discount rate is determined using our assumption on market conditions adjusted for market and credit risk and current returns on our investments. The discount rate used to value our future cash inflows of the mortgage loans receivable at September 30, 2025 and December 31, 2024 was |
| (3) | Our investments in notes receivable are classified as Level 3. The discount rate is determined using our assumption on market conditions adjusted for market and credit risk and current returns on our investments. The discount rate used to value our future cash flows of the notes receivable at September 30, 2025 and December 31, 2024 was |
| (4) | Our revolving line of credit and term loans bear interest at a variable interest rate. The estimated fair value of our revolving line of credit and term loans approximated their carrying values at September 30, 2025 and December 31, 2024 upon prevailing market interest rates for similar debt arrangements. During the three months ended September 30, 2025, the Term Loans were rolled into our new revolving line of credit. |
| (5) | Our obligation under our senior unsecured notes is classified as Level 3 and thus the fair value is determined using a widely accepted valuation technique, discounted cash flow analysis on the expected cash flows. The discount rate is measured based upon management’s estimates of rates currently prevailing for comparable loans available to us, and instruments of comparable maturities. At September 30, 2025, the discount rate used to value our future cash outflow of our senior unsecured notes was |
16. | Segment Information |
We use the management approach in determining the reportable operating segments. The management approach considers the internal organization and reporting used by our chief operating decision maker (“CODM”) for making operating decisions, allocating resources and assessing performance as the source for determining our reportable segments. In making this determination, we:
| i. | Determine our CODM; |
| ii. | identify and analyze our potential business components; |
| iii. | identify our operating segments; and |
| iv. | determine whether there are multiple operating segments requiring presentation as separate reportable segments. |
33
LTC PROPERTIES, INC.
NOTES TO CONSOLIDATED FINANCIAL STATEMENTS CONTINUED
(Unaudited)
During the nine months ended September 30, 2025 and 2024, the CODM has been collectively identified as our Executive Chairman and Co-CEOs, who share the responsibility for allocating resources and assessing segment performance.
During the second quarter of 2025, we began utilizing the RIDEA structure and established our SHOP segment. Accordingly, we conduct and manage our business as
Three Months Ended September 30, 2025 | ||||||||||||
Real estate | Non-segment | |||||||||||
| investment portfolio |
| SHOP |
| /corporate |
| Total | |||||
Revenues: | ||||||||||||
Rental income | $ | | $ | — | $ | — | $ | | ||||
Resident fees and services | — | | — | | ||||||||
Interest income from financing receivables | | — | — | | ||||||||
Interest income from mortgage loans | | — | — | | ||||||||
Interest and other income | | — | | | ||||||||
Total revenues | | | | | ||||||||
Income from unconsolidated joint ventures | | — | — | | ||||||||
Property level expenses | ( | ( | — | ( | ||||||||
NOI | | | | | ||||||||
Interest expense | ( | |||||||||||
Depreciation and amortization | ( | |||||||||||
Write-off of effective interest receivable | ( | |||||||||||
Provision for credit losses | ( | |||||||||||
Transaction costs | ( | |||||||||||
General and administrative expenses | ( | |||||||||||
Loss on sale of real estate, net | ( | |||||||||||
Income tax expense | ( | |||||||||||
Net loss | $ | ( | ||||||||||
Nine Months Ended September 30, 2025 | ||||||||||||
Real estate | Non-segment | |||||||||||
| investment portfolio |
| SHOP |
| /Corporate |
| Total | |||||
Revenues: | ||||||||||||
Rental income | $ | | $ | — | $ | — | $ | | ||||
Resident fees and services | — | | — | | ||||||||
Interest income from financing receivables | | — | — | | ||||||||
Interest income from mortgage loans | | — | — | | ||||||||
Interest and other income | | — | | | ||||||||
Total revenues | | | | | ||||||||
Income from unconsolidated joint ventures | | — | — | | ||||||||
Property level expenses | ( | ( | — | ( | ||||||||
NOI | | | | | ||||||||
Interest expense | ( | |||||||||||
Depreciation and amortization | ( | |||||||||||
Write-off of effective interest receivable | ( | |||||||||||
Provision for credit losses | ( | |||||||||||
Transaction costs | ( | |||||||||||
General and administrative expenses | ( | |||||||||||
Loss on sale of real estate, net | ( | |||||||||||
Income tax benefit | | |||||||||||
Net income | $ | | ||||||||||
34
LTC PROPERTIES, INC.
NOTES TO CONSOLIDATED FINANCIAL STATEMENTS CONTINUED
(Unaudited)
During the three and nine months ended September 30, 2024, we operated under
Three Months Ended September 30, 2024 | ||||||||||||
Real estate | Non-segment | |||||||||||
| investment portfolio |
| SHOP |
| /corporate |
| Total | |||||
Revenues: | ||||||||||||
Rental income | $ | | $ | — | $ | — | $ | | ||||
Resident fees and services | — | — | — | — | ||||||||
Interest income from financing receivables | | — | — | | ||||||||
Interest income from mortgage loans | | — | — | | ||||||||
Interest and other income | | — | | | ||||||||
Total revenues | | — | | | ||||||||
Income from unconsolidated joint ventures | | — | — | | ||||||||
Property level expenses | ( | — | — | ( | ||||||||
NOI | | — | | | ||||||||
Expenses: | ||||||||||||
Interest Expense | ( | |||||||||||
Depreciation and Amortization | ( | |||||||||||
Impairment Loss | — | |||||||||||
Transaction costs | ( | |||||||||||
Recovery for credit losses | ( | |||||||||||
General and administrative expenses | ( | |||||||||||
Gain on sale of real estate, net | | |||||||||||
Income tax benefit | — | |||||||||||
Net income | $ | | ||||||||||
Nine Months Ended September 30, 2024 | ||||||||||||
Real estate | Non-segment | |||||||||||
| investment portfolio |
| SHOP |
| /corporate |
| Total | |||||
Revenues: | ||||||||||||
Rental income | $ | | $ | — | $ | — | $ | | ||||
Resident fees and services | — | — | — | — | ||||||||
Interest income from financing receivables | | — | — | | ||||||||
Interest income from mortgage loans | | — | — | | ||||||||
Interest and other income | | — | | | ||||||||
Total revenues | | — | | | ||||||||
Income from unconsolidated joint ventures | | — | — | | ||||||||
Property level expenses | ( | — | — | ( | ||||||||
NOI | | — | | | ||||||||
Expenses: | ||||||||||||
Interest Expense | ( | |||||||||||
Depreciation and Amortization | ( | |||||||||||
Impairment Loss | — | |||||||||||
Transaction costs | ( | |||||||||||
Recovery for credit losses | ( | |||||||||||
General and administrative expenses | ( | |||||||||||
Gain on sale of real estate, net | | |||||||||||
Income tax benefit | — | |||||||||||
Net income | $ | | ||||||||||
Total assets by reportable business segment and segment-level significant expense categories are not disclosed as our CODM do not review such information to evaluate business performance and allocate resources.
35
LTC PROPERTIES, INC.
NOTES TO CONSOLIDATED FINANCIAL STATEMENTS CONTINUED
(Unaudited)
17. | Income Taxes |
Our Company qualifies as a REIT under Sections 856 through 860 of the Internal Revenue Code of 1986, as amended. As such, we generally are not taxed on income that is distributed to our stockholders. Under RIDEA, a REIT may lease a "qualified healthcare property" on an arm's-length basis to a taxable REIT subsidiary ("TRS") if the property is operated on behalf of such TRS by a person who qualifies as an “eligible independent operator”. Generally, the rent received from the TRS will meet the related party exception and will be treated as “rents from real property”. A "qualified healthcare property" includes real property and any personal property that is, or is necessary or incidental to the use of, a hospital, nursing facility, assisted living facility, congregate care facility, qualified continuing care facility, or other licensed facility which extends medical or nursing or ancillary services to patients. Resident fees and services revenue and related operating expenses for these facilities are reported on our Consolidated Statements of Income and are subject to federal, state and local income taxes. Our provision for income taxes for the three and nine months ended September 30, 2025, was an expense of $
18. | Subsequent Events |
Subsequent to September 30, 2025, the following events occurred:
Real Estate. We acquired an
Property Sales. We sold
Debt. We repaid $
Equity: We sold
Additionally, we declared a monthly cash dividend of $
36
Item 2.MANAGEMENT’S DISCUSSION AND ANALYSIS OF FINANCIAL CONDITION AND RESULTS OF OPERATIONS
Cautionary Statement Regarding Forward-Looking Statements
This quarterly report contains forward-looking statements within the meaning of Section 27A of the Securities Act of 1933, as amended, and Section 21E of the Exchange Act adopted pursuant to the Private Securities Litigation Reform Act of 1995. Statements that are not purely historical may be forward-looking. You can identify some of the forward-looking statements by their use of forward-looking words, such as “believes,” “expects,” “may,” “will,” “could,” “would,” “should,” “seeks,” “approximately,” “intends,” “plans,” “estimates” or “anticipates,” or the negative of those words or similar words. Forward-looking statements involve inherent risks and uncertainties regarding events, conditions and financial trends that may affect our future plans of operation, business strategy, results of operations and financial position. A number of important factors could cause actual results to differ materially from those included within or contemplated by such forward-looking statements, including, but not limited to, our dependence on our operators for revenue and cash flow; operational and legal risks and liabilities under our new SHOP segment; government regulation of the health care industry; changes in federal, state, or local laws limiting real estate investment trust (“REIT”) investments in the health care sector; federal and state health care cost containment measures including reductions in reimbursement from third-party payors such as Medicare and Medicaid; required regulatory approvals for operation of health care facilities; a failure to comply with federal, state, or local regulations for the operation of health care facilities; the adequacy of insurance coverage maintained by our operators; our reliance on a few major operators; our ability to renew leases or enter into favorable terms of renewals or new leases; the impact of inflation, operator financial or legal difficulties; the sufficiency of collateral securing mortgage loans; an impairment of our real estate investments; the relative illiquidity of our real estate investments; our ability to develop and complete construction projects; our ability to invest cash proceeds for health care properties; a failure to qualify as a REIT; our ability to grow if access to capital is limited; and a failure to maintain or increase our dividend. For a discussion of these and other factors that could cause actual results to differ from those contemplated in the forward-looking statements, please see the discussion under “Risk Factors” contained in our Annual Report on Form 10-K for the fiscal year ended December 31, 2024 and in our publicly available filings with the Securities and Exchange Commission. We do not undertake any responsibility to update or revise any of these factors or to announce publicly any revisions to forward-looking statements, whether as a result of new information, future events or otherwise. Although our management believes that the assumptions and expectations reflected in such forward-looking statements are reasonable, no assurance can be given that such expectations will prove to have been correct. The actual results may differ materially from any forward-looking statements due to the risks and uncertainties of such statements.
Executive Overview
Business and Investment Strategy
We are a REIT that invests in seniors housing and health care properties through sale-leasebacks, financing receivables, mortgage financing, joint ventures and structured finance solutions including preferred equity and mezzanine lending. We create, sustain and enhance stockholder equity value and provide current income for distribution to stockholders through real estate investments in seniors housing and health care properties managed by experienced operators.
37
The following graph summarizes our gross investments as of September 30, 2025:
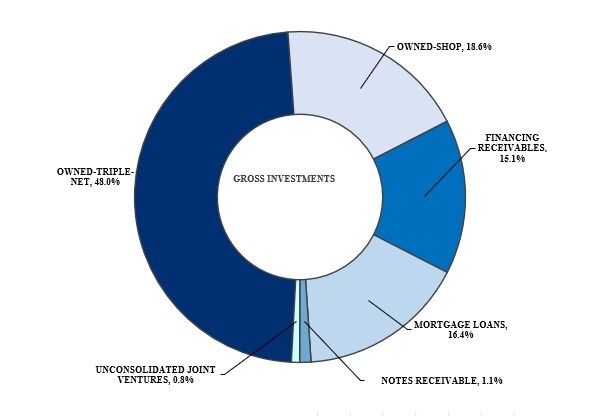
Our primary seniors housing and health care property classifications include skilled nursing centers (“SNF”), independent living communities (“ILF”), assisted living communities (“ALF”), memory care communities (“MC”) and combinations thereof. We also invest in other (“OTH”) types of properties, such as land parcels, projects under development (“UDP”) and behavioral health care hospitals. To meet these objectives, we attempt to invest in properties that provide opportunity for additional value and current returns to our stockholders and diversify our investment portfolio by geographic location, operator, property classification and form of investment. Additionally, during the second quarter of 2025, we began utilizing the structure authorized by the REIT Investment Diversification and Empowerment Act of 2007 (Commonly referred to as “RIDEA”) as permitted by the Housing and Economic Recovery Act of 2008.
We conduct and manage our business as two operating segments for internal reporting and internal decision-making purposes: real estate investments and seniors housing operating portfolio (“SHOP”). For purposes of this quarterly report and other presentations, we generally include ILF, ALF, MC, and combinations thereof in the seniors housing communities classification (“SH”). As of September 30, 2025, seniors housing and health care properties comprised approximately 99.5% of our gross investment portfolio. We have been operating since August 1992.
Substantially all of our revenues and sources of cash flows from operations are derived from rents from operating leases, resident fees and services, interest earned on financing receivables, interest earned on outstanding loans receivable and income from investments in unconsolidated joint ventures. Income from our investments represent our primary source of liquidity to fund distributions and are dependent upon the performance of the operators on their lease and loan obligations and the rates earned thereon. To
38
the extent that the operators experience operating difficulties and are unable to generate sufficient cash to make payments to us, there could be a material adverse impact on our consolidated results of operations, liquidity and/or financial condition. To mitigate this risk, we monitor our investments through a variety of methods determined by investment type, property type and operator. Our monitoring process includes periodic review of financial statements for each facility, periodic review of operator credit, scheduled property inspections and review of covenant compliance.
In addition to our monitoring and research efforts, we also structure our investments to help mitigate payment risk. Some operating leases and loans are credit enhanced by guaranties and/or letters of credit. In addition, operating leases are typically structured as master leases and loans are generally cross-defaulted and cross-collateralized with other loans, operating leases or agreements between us and the operator and its affiliates.
During the second quarter of 2025, we began utilizing the structures provided for in the REIT Investment Diversification and Empowerment Act of 2007 (commonly referred to as “RIDEA”) as permitted by the Housing and Economic Recovery Act of 2008 and established a seniors housing operating portfolio (“SHOP”). Under a typical RIDEA structure, we have certain oversight approval rights and the right to review operational and financial reporting information, but our independent third party operators will ultimately control the day-to-day operations of the property, pursuant to the terms of our management agreements. Offering RIDEA structures represent a further aspect of our traditional strategy of investing through vehicles such as non-cancelable triple-net operating (“NNN” or “Triple-Net”) leases, mortgage loans, and structured finance. We believe that RIDEA structures provide us with additional investment opportunities. During the second quarter of 2025, we terminated the Anthem Memory Care, LLC (“Anthem”) and New Perspective Senior Living, LLC (“New Perspective”) Triple-Net master leases and converted the 13 communities covered under the master leases to our new SHOP segment. Additionally, we acquired eight seniors housing communities within our SHOP segment. Accordingly, as of September 30, 2025, our SHOP segment is comprised of 21 independent living, assisted living and memory care communities that are managed on behalf of LTC by five independent operators pursuant to the terms of separate management agreements. To develop and implement RIDEA structures, we may need to continue to commit financial and operational resources. While we anticipate that adding RIDEA transactions will be positive for our business model, our ability to succeed in this new segment will be determined by numerous factors, including our ability to identify suitable investments and our relationship with operators of RIDEA structures.
Depending upon the availability and cost of external capital, we anticipate making additional investments in health care related properties. New investments are generally funded from cash on hand, proceeds from periodic asset sales, temporary borrowings under our unsecured revolving line of credit and internally generated cash flows. Our investments generate internal cash from rent, resident fees and services, interest from financing receivables and interest receipts and principal payments on loan receivables and income from unconsolidated joint ventures. Permanent financing for future investments, which replaces funds drawn under our unsecured revolving line of credit, may be provided through a combination of public and private offerings of debt and equity securities and secured and unsecured debt financing. The timing, source and amount of cash flows provided by financing activities and used in investing activities are sensitive to the capital markets’ environment, especially to changes in interest rates. Changes in the capital markets’ environment may impact the availability of cost-effective capital.
We believe our business model has enabled and will continue to enable us to maintain the integrity of our property investments, including in response to financial difficulties that may be experienced by operators and the variability of cash flow from our SHOP segment. Traditionally, we have taken a conservative approach to managing our business, choosing to maintain liquidity and exercise patience until favorable investment opportunities arise.
39
Real Estate Portfolio Overview
The following tables summarize our real estate investment portfolio as of September 30, 2025 (dollar amounts in thousands):
Nine Months Ended | ||||||||||||||||||||
September 30, 2025 | ||||||||||||||||||||
Number of | Percentage | Rental Income | Percentage | |||||||||||||||||
Number of | SNF | SH | Gross | of | and Resident | of Total | ||||||||||||||
Owned Properties | Properties (1) | Beds | Units | Investments | Investments | Fees and Services | Revenues | |||||||||||||
Owned-Triple-Net: | ||||||||||||||||||||
Seniors Housing | 56 | — | 3,404 | $ | 538,256 | 22.4 | % | $ | 30,024 | 18.3 | % | |||||||||
Skilled Nursing | 50 | 6,113 | 236 | 599,663 | 25.1 | % | 47,635 | 29.1 | % | |||||||||||
Other (2) | 1 | 118 | — | 12,005 | 0.5 | % | 297 | 0.2 | % | |||||||||||
Subtotal: Triple-Net | 107 | 6,231 | 3,640 | 1,149,924 | 48.0 | % | 77,956 | (4) | 47.6 | % | ||||||||||
Owned-SHOP: | ||||||||||||||||||||
Seniors Housing | 21 | — | 1,577 | 446,527 | 18.6 | % | 34,153 | (5) | 20.8 | % | ||||||||||
Total Owned Properties | 128 | 6,231 | 5,217 | 1,596,451 | 66.6 | % | 112,109 | 68.4 | % | |||||||||||
Number of | Percentage | Interest Income | Percentage | |||||||||||||||||
Number of | SNF | SH | Gross | of | from Financing | of Total | ||||||||||||||
Financing Receivables | Properties (1) | Beds | Units | Investments | Investments | Receivable | Revenues | |||||||||||||
Seniors Housing | 28 | — | 1,263 | 285,656 | 11.9 | % | 16,803 | 10.2 | % | |||||||||||
Skilled Nursing | 3 | 299 | — | 76,545 | 3.2 | % | 4,379 | 2.7 | % | |||||||||||
Total Financing Receivables | 31 | 299 | 1,263 | 362,201 | 15.1 | % | 21,182 | 12.9 | % | |||||||||||
Number of | Percentage | Interest Income | Percentage | |||||||||||||||||
Number of | SNF | SH | Gross | of | from Mortgage | of Total | ||||||||||||||
Mortgage Loans | Properties (1) | Beds | Units | Investments | Investments | Loans | Revenues | |||||||||||||
Seniors Housing | 6 | — | 663 | 137,873 | 5.8 | % | 4,542 | 2.8 | % | |||||||||||
Skilled Nursing | 21 | 2,576 | — | 254,537 | 10.6 | % | 22,865 | 13.9 | % | |||||||||||
Under Development (3) | — | — | — | 1,177 | 0 | % | 8 | 0.0 | % | |||||||||||
Total Mortgage Loans | 27 | 2,576 | 663 | 393,587 | 16.4 | % | 27,415 | (6) | 16.7 | % | ||||||||||
Number of | Percentage | Interest | Percentage | |||||||||||||||||
Number of | SNF | SH | Gross | of | and other | of Total | ||||||||||||||
Notes Receivable | Properties (1) | Beds | Units | Investments | Investments | Income | Revenues | |||||||||||||
Seniors Housing | 5 | — | 621 | 25,982 | 1.1 | % | 1,970 | 1.2 | % | |||||||||||
Skilled Nursing | — | — | — | 1,028 | 0.0 | % | — | 0.0 | % | |||||||||||
Total Notes Receivable | 5 | — | 621 | 27,010 | 1.1 | % | 1,970 | (7) | 1.2 | % | ||||||||||
Number of | Percentage | Income from | Percentage | |||||||||||||||||
Number of | SNF | SH | Gross | of | Unconsolidated | of Total | ||||||||||||||
Unconsolidated Joint Ventures | Properties (1) | Beds | Units | Investments | Investments | Joint Ventures | Revenues | |||||||||||||
Seniors Housing | 1 | — | 109 | 6,340 | 0.3 | % | 884 | 0.5 | % | |||||||||||
Skilled Nursing | 1 | 104 | — | 12,002 | 0.5 | % | 434 | 0.3 | % | |||||||||||
Total Unconsolidated Joint Ventures | 2 | 104 | 109 | 18,342 | 0.8 | % | 1,318 | (8) | 0.8 | % | ||||||||||
Total Portfolio | 193 | 9,210 | 7,873 | $ | 2,397,591 | 100.0 | % | $ | 163,994 | 100.0 | % | |||||||||
Number | Number of | Percentage | |||||||||||
of | SNF | SH | Gross | of | |||||||||
Summary of Properties by Type | Properties (1) | Beds | Units | Investments | Investments | ||||||||
Seniors Housing | 117 | — | 7,637 | $ | 1,440,634 | 60.1 | % | ||||||
Skilled Nursing | 75 | 9,092 | 236 | 943,775 | 39.4 | % | |||||||
Other (2) | 1 | 118 | — | 12,005 | 0.5 | % | |||||||
Under Development (3) | — | — | — | 1,177 | — | % | |||||||
Total Portfolio | 193 | 9,210 | 7,873 | $ | 2,397,591 | 100.0 | % | ||||||
| (1) | We have investments in owned properties, including Triple-Net and SHOP, financing receivables, mortgage loans, notes receivable and unconsolidated joint ventures in 25 states to 31 operators. |
| (2) | Includes three parcels of land held-for-use and one behavioral health care hospital. |
| (3) | We funded $1,177 under a $26,120 mortgage loan commitment for the construction of a 116-unit ILF, ALF and MC located in Illinois. The loan bears interest at a current rate of 9.0 % and an IRR of 9.5%. |
| (4) | Excludes $8,448 variable rental income from lessee reimbursement of our real estate taxes, $4,573 rental income related to termination of master leases and converting the communities into our new SHOP and $1,514 write-off of straight-line rent. |
| (5) | Resident fees and services include all amounts earned from residents, based on individual resident agreements, at our SHOP communities. |
| (6) | Excludes $1,300 of interest income related to mortgage loan receivables that have been paid off. |
| (7) | Included in the Interest and other income line item of our Consolidated Statements of Income. Excludes $2,672 interest income from loans that have been paid off. |
| (8) | Excludes income from the redemption of our preferred equity investment in a joint venture. |
40
As of September 30, 2025, we had $2.0 billion in net carrying value of investments as follows (dollar amounts in thousands):
Percentage | ||||||
Carrying | of | |||||
Value | Investments | |||||
Owned-Triple-Net | $ | 769,326 | 39.2 | % | ||
Owned-SHOP | 399,824 | 20.4 | % | |||
Financing Receivables | 358,579 | 18.2 | % | |||
Mortgage Loans | 389,657 | 19.9 | % | |||
Notes Receivable | 26,740 | 1.4 | % | |||
Unconsolidated Joint Ventures | 18,342 | 0.9 | % | |||
$ | 1,962,468 | 100.0 | % | |||
The following table provides details on the components of revenues and related net operating income (“NOI”) across our portfolio (in thousands):
Three Months Ended | Nine Months Ended | |||||
September 30, 2025 | ||||||
Real Estate Investment segment: | ||||||
Owned-Triple-Net | ||||||
Contractual cash rental income | $ | 27,079 | $ | 84,781 | ||
Variable cash rental income | 2,582 | 8,448 | ||||
Straight-line rent adjustment (1) | (372) | (1,447) | ||||
Adjustment of lease incentives and rental income | (1,271) | (1,514) | ||||
Amortization of lease incentives | (176) | (805) | ||||
Rental income | 27,842 | 89,463 | ||||
Financing Receivables: | ||||||
Cash Interest income from financing receivables | 6,731 | 20,161 | ||||
Effective interest income (2) | 365 | 1,021 | ||||
Interest income from financing receivables | 7,096 | 21,182 | ||||
Mortgage loans receivable: | ||||||
Cash interest received | 9,492 | 26,395 | ||||
Effective interest income (3) | 364 | 2,320 | ||||
Interest income from mortgage loans | 9,856 | 28,715 | ||||
Other notes receivable: | ||||||
Interest income-other notes | 3,656 | 5,789 | ||||
Effective interest adjustment (4) | (1,465) | (1,147) | ||||
Interest income from notes receivable | 2,191 | 4,642 | ||||
Unconsolidated joint ventures | ||||||
Income from unconsolidated joint ventures | 439 | 4,543 | ||||
Total revenue-Real Estate Investments segment | 47,424 | 148,545 | ||||
Property level expenses-real estate investments | (2,581) | (8,483) | ||||
NOI-Real Estate Investment segment (5) | $ | 44,843 | $ | 140,062 | ||
SHOP segment: | ||||||
Resident Fees and Services: | $ | 22,203 | $ | 34,153 | ||
Property level expenses-SHOP | (17,362) | (26,781) | ||||
NOI-SHOP segment (5) | $ | 4,841 | $ | 7,372 | ||
| (1) | At September 30, 2025, the straight-line rent receivable balance on our Consolidated Balance Sheets was $18,545. |
| (2) | At September 30, 2025, the financing receivables effective interest receivable balance which is included in the Interest receivable line item on our Consolidated Balance Sheets was $6,517. |
| (3) | At September 30, 2025, the mortgage loans receivable effective interest receivable balance which is included in the interest receivable line item on our Consolidated Balance Sheets was $13,698. |
| (4) | At September 30, 2025, the other notes receivable effective interest receivable balance which is included in the interest receivable line item on our Consolidated Balance Sheets was $97. |
| (5) | See Non-GAAP Financial Measures below for additional information and reconciliation. |
41
The following table outlines information related to our Triple-Net lease extensions during the nine months ended September 30, 2025 (dollar amounts in thousands):
Number | Number | ||||||||||||
Gross | of | of | Original | Extended | |||||||||
Type of Property | Investment | Properties | Beds/Units | State | Maturity | Maturity | |||||||
SH | $ | 68,767 | 7 | 461 | IL, MI, OH | May 31, 2025 | May 31, 2026 | ||||||
SNF | 53,339 | 6 | 782 | AL, NM | April 30, 2026 | (1) | April 30, 2031 | ||||||
SH | 32,361 | 2 | 159 | GA, SC | December 31, 2025 | December 31, 2026 | |||||||
SH | 25,704 | 2 | 88 | TX | February 28, 2025 | February 28, 2026 | |||||||
SNF | 13,053 | 2 | 211 | SC | February 28, 2026 | February 28, 2031 | |||||||
SNF | 5,275 | 2 | 141 | TN | December 31, 2025 | (2) | December 31, 2026 | ||||||
$ | 198,499 | 21 | 1,842 |
| (1) | Subsequent to September 30, 2025, Genesis Healthcare, Inc. (“Genesis”) filed for Chapter 11 bankruptcy. Genesis has paid their contractual rent through November 2025. |
| (2) | The purchase option window provided in the master lease, which expired on December 31, 2024, was extended for another year to December 31, 2025. |
Additionally, During 2025, we terminated two existing leases with the same operator and combined them into a single master lease. The new combined master lease has a five-year term with one 1-year extension option and four 5-year extension options. Annual cash rent is $2.5 million for the first lease year escalating by 2.0% annually thereafter. The terms and economics of the new combined master lease are similar to those of the two leases that were terminated. In connection with the termination of these leases, we wrote-off straight-line rent receivable and lease incentive balances totaling $0.5 million. During the fourth quarter of 2025, we expect to convert these seniors housing communities under the new combined master lease from our triple-net portfolio into our SHOP segment. Upon conversion, the new combined master lease will be terminated, and we will enter into a management agreement with an operator new to us. In conjunction with the new master lease termination, we expect to write-off a $1.0 million working capital note during the fourth quarter of 2025.
Also, as previously discussed, during 2025, we terminated the Anthem Triple-Net master leases and converted the communities covered under the master leases into our new SHOP segment. In conjunction with the conversion, we wrote-off Anthem’s working capital note of $2.7 million and the related interest receivable of $0.4 million. In addition, we terminated our New Perspective Triple-Net lease and converted the community covered under the lease into our SHOP segment. In connection with the conversion, we paid New Perspective a $6.0 million lease termination fee.
42
Update on Certain Operators
ALG Senior Living
We hold controlling interest in three joint ventures with ALG Senior Living (“ALG”). The joint ventures own 28 assisted living and memory care communities in North Carolina (27) and South Carolina (1) with a total of 1,263 units. The joint ventures lease these communities to affiliates of ALG under three 10-year master leases and has provided the lessee with the option to purchase these communities. In accordance with generally accepted accounting principles (“GAAP”), the communities are recorded as Financing Receivables on our Consolidated Balance Sheets. Additionally, ALG operates a 45-unit assisted living and memory care community in North Carolina under a mortgage loan, which was scheduled to mature in January 2025. During 2025, the mortgage loan maturity was extended to May 2026. ALG has paid their contractual rent and interest obligations through November 2025.
Anthem Memory Care
Anthem operated 12 memory care communities located in California, Colorado, Kansas, Illinois and Ohio under Triple-Net master leases. During the second quarter of 2025, we terminated the Anthem Triple-Net master leases and converted the 12 memory care communities covered under the master leases into our new SHOP segment. In conjunction with the conversion, we wrote-off Anthem’s working capital note of $2.7 million and the related interest receivable of $0.4 million during the second quarter of 2025.
Genesis Healthcare, Inc.
During the second quarter of 2025, we received Genesis’ written notice of its exercise of a 5-year extension option, which would extend the term of the lease to April 30, 2031. During the third quarter of 2025, Genesis filed for Chapter 11 bankruptcy. Accordingly, we wrote-off straight-line rent receivable balance of $1.3 million related to Genesis’ master lease. Affiliates of Genesis lease six skilled nursing centers in New Mexico (five) and Alabama (one) with a total of 782 beds under a master lease with LTC. Genesis has paid their contractual rent through November 2025.
Prestige Healthcare
Prestige Healthcare (“Prestige”) operates 21 skilled nursing centers located in Michigan secured under four mortgage loans and two skilled nursing centers located in South Carolina under a master lease. Prestige is our largest operator based upon revenues and assets representing 13.3% of our total revenues and 12.7% of our total assets as of September 30, 2025.
Prior to an amendment in July 2025, under one of the mortgage loans with Prestige secured by 14 properties, the minimum mortgage interest payment due to us was based on an annual current pay rate of 8.5% on the outstanding loan balance. The difference between the contractual interest rate and the current pay interest rate on the outstanding loan balance remained an obligation of Prestige and was payable through the application of security deposits we hold on behalf of Prestige or was payable at maturity
During the first quarter of 2025, we received full contractual cash interest of $5.0 million from Prestige through $3.8 million of cash receipts and application of $1.2 million of Prestige’s security. At March 31, 2025, Prestige’s security totaled $3.8 million.
During the second quarter of 2025, we received full contractual cash interest of $5.0 million from Prestige. None of Prestige’s security was used to pay the difference between the contractual interest rate and the 8.5% current pay interest rate.
43
During the third quarter of 2025, the Prestige mortgage loan was modified to increase the current interest paid by Prestige from 8.5% to the full contractual interest rate of 11.14% and escalated annually. The modification was effective July 1, 2025. Additionally, the modification provides Prestige an option to prepay their mortgage loan at par and without penalty within a 12-month window beginning in July 2026. Prestige is required to provide us with a 90-day notice of its intention to exercise the option and the ability for Prestige to exercise the pre-payment option is contingent on several factors including Prestige being current and in good standing on all its mortgage loans with LTC and obtaining replacement financing. In conjunction with the loan amendment that provided the borrower with a penalty-free early payoff option, we wrote-off $41.5 million of interest receivable previously accrued related to this loan during the three months ended September 30, 2025. Prestige is current on their contractual loan obligations through November 2025.
Other Operators
We had a JV that owned two assisted living communities with a total of 186 units in Oregon. The communities were leased under two separate leases with the same operator, who was the non-controlling member of the JV. During 2025, we acquired the operator’s $4.0 million non-controlling interest in the JV for $1.2 million and terminated the two existing leases. In connection with the termination of these leases, we wrote-off $0.2 million straight-line rent receivable and $0.3 million lease incentive. Concurrently, we entered into a new combined master lease with the same operator. The new combined master lease has a five-year term with one 1-year extension option and four 5-year extension options. Annual cash rent is $2.5 million for the first lease year, escalating by 2% annually thereafter. Additionally, the master lease provides the operator with an earn-out of up to $4.0 million, contingent on achieving certain performance thresholds. During the fourth quarter of 2025, we expect to convert these two assisted living communities under the new combined master lease from our triple-net portfolio into our SHOP segment. Upon conversion, the new combined master lease will be terminated, and we will enter into a management agreement with an operator new to us. In conjunction with the new master lease termination, we expect to write-off a $1.0 million working capital note during the fourth quarter of 2025.
Additionally, during the first quarter of 2025, we engaged a broker to sell seven skilled nursing centers under a master lease, following the operator’s election not to exercise the renewal option available under the master lease. The master lease covered seven skilled nursing centers in California (1), Florida (2) and Virginia (4) with a gross book value of $71.7 million and was set to mature in January 2026. Accordingly, these centers met the criteria under GAAP as held-for-sale and have been classified as held-for-sale. The operator is obligated to pay rent on the portfolio through maturity and is current on rent obligations through November 2025. Subsequent to September 30, 2025, we sold two skilled nursing centers within this portfolio located in Florida with a total of 240 beds for $43.0 million. We received $41.9 million of net proceeds and expect to record a gain on sale of approximately $26.0 million. Additionally, we sold the remaining five skilled nursing centers in Virginia (4) and California (1) with a total of 656 beds for an aggregate sales price of $80.0 million. We will use the total proceeds of $78.9 million in a 1031 exchange for the acquisitions within our SHOP segment and anticipate recording an aggregate gain on sale of approximately $52.0 million. These seven properties, which were classified as held-for-sale at September 30, 2025, had an aggregate gross book value and net book value of $71.7 million and $42.5 million, respectively.
44
2025 Activities Overview
The following tables summarize our transactions during the nine months ended September 30, 2025 (dollar amounts in thousands):
SHOP Segment
During the second quarter of 2025, we r the Anthem and New Perspective Triple-Net master leases and converted the communities covered under the master leases into our new SHOP segment. Additionally, during the third quarter of 2025, we acquired eight seniors housing communities within our SHOP segment. Accordingly, as of September 30, 2025, our SHOP segment is comprised of 21 independent living, assisted living and memory care communities that are managed on behalf by five independent operators pursuant to separate management agreements. The following table provides information regarding our SHOP segment as of September 30, 2025 (dollar amounts in thousands):
Average | ||||||||||
Number | Number | Investment | ||||||||
Gross | of | of | per | |||||||
State | Investment | Properties | Beds/Units | Unit | ||||||
Wisconsin | $ | 217,165 | 6 | 620 | $ | 350.27 | ||||
Illinois | 57,998 | 4 | 264 | $ | 219.69 | |||||
California | 48,695 | 2 | 133 | $ | 366.13 | |||||
Colorado | 41,744 | 4 | 228 | $ | 183.09 | |||||
Kentucky | 39,684 | 2 | 158 | $ | 251.16 | |||||
Kansas | 26,220 | 2 | 114 | $ | 230.00 | |||||
Ohio | 15,021 | 1 | 60 | $ | 250.35 | |||||
Total | $ | 446,527 | (1) | 21 | 1,577 | $ | 283.15 | |||
| (1) | Subsequent to September 30, 2025, we acquired within our SHOP segment an 88-unit SH in Georgia for $22,900. In conjunction with the acquisition, we entered into a management agreement with an operator new to us. Additionally, we expect to convert two SH from our triple-net portfolio into our SHOP segment during the fourth quarter of 2025. The communities are located in Oregon with a total of 186 units, with an aggregate gross book value of $33,102 and a net book value of $26,535. Upon conversion, the Triple-Net master lease with the existing operator will be terminated and we will enter into a new management agreement with an operator new to us. |
The following table summarizes our acquisitions within our SHOP segment during the nine months ended September 30, 2025 (dollar amounts in thousands):
Total | Number | Number |
| |||||||||||||
Purchase | Transaction | Acquisition | of | of |
| |||||||||||
Type of Property | State | Price | Costs | Costs | Properties | Beds/Units |
| |||||||||
SH | CA | $ | 35,200 | $ | 247 | $ | 35,447 | 1 | 67 | |||||||
SH | KY | 39,500 | 184 | 39,684 | 2 | 158 | ||||||||||
SH | WI | 194,050 | 165 | 194,215 | 5 | 520 | ||||||||||
$ | 268,750 | (1) | $ | 596 | $ | 269,346 | 8 | 745 | ||||||||
| (1) | Subsequent to September 30, 2025, we acquired an 88-unit seniors housing community within our SHOP segment in Georgia for $22,900. In conjunction with the acquisition, we entered into a management agreement with an operator new to us. |
Investment in Improvement projects
Type of Property | NNN | SHOP | ||||
Seniors Housing Communities | $ | 2,648 | $ | 2,425 | ||
Skilled Nursing Centers | 1,600 | — | ||||
Total | $ | 4,248 | $ | 2,425 | ||
45
Properties Held -for-Sale
Type | Number | Number | ||||||||||
of | of | of | Gross | Accumulated | ||||||||
State | Property | Properties | Beds/units | Investment | Depreciation | |||||||
CA/FL/VA | SNF | (1) | 7 | 896 | $ | 71,742 | $ | (29,284) |
| (1) | These properties were sold subsequent to September 30, 2025. See footnote (3) to the Properties Sold table below for additional information. |
Properties Sold
Type | Number | Number | ||||||||||||||
of | of | of | Sales | Carrying | Net | |||||||||||
State | Properties | Properties | Beds/Units | Price | Value | (Loss) Gain (1) | ||||||||||
Ohio | SH | 1 | 39 | $ | 1,000 | $ | 670 | $ | 236 | |||||||
Ohio (2) | n/a | — | — | 1,800 | 1,342 | 340 | ||||||||||
Oklahoma | SH | 1 | 29 | 670 | 670 | (96) | ||||||||||
Texas | n/a | 1 | — | 2,880 | 3,266 | (715) | ||||||||||
Total (3) | 3 | 68 | $ | 6,350 | $ | 5,948 | $ | (235) |
| (1) | Calculation of net (loss) gain includes cost of sales and write-off of straight-line receivable and lease incentives, when applicable. |
| (2) | We sold a parcel of land adjacent to a memory care community within our portfolio. |
| (3) | Subsequent to September 30, 2025, we sold two skilled nursing centers in Florida totaling 240 beds for $43,000. We received $41,900 of net proceeds and expect to record a gain on sale of approximately $26,000. Additionally, we sold five skilled nursing centers in Virginia (4) and California (1) with a total of 656 beds for an aggregate sales price of $79,950. We will use the total proceeds of $78,900 in a 1031 exchange for the acquisitions within our SHOP segment and anticipate recording an aggregate gain on sale of approximately $52,000. These seven properties, which were classified as held-for-sale at September 30, 2025, had an aggregate gross book value and net book value of $71,742 and $42,458, respectively. |
46
Investment in Mortgage Loans Receivable
The following tables provide information regarding our investments in mortgage loans secured by first mortgages at September 30, 2025 (dollar amounts in thousands):
Type | Percentage | Number of | Investment | ||||||||||||||||||||
Gross | of | of | SNF | SH | per |
| |||||||||||||||||
Interest Rate | Maturity | State | Investment | Property | Investment | Loans (2) | Properties (3) | Beds | Units | Bed/Unit |
| ||||||||||||
7.8% | 2025 | FL | $ | 15,956 | SH | 4.0 | % | 1 | 1 | — | 112 | $ | 142.46 | ||||||||||
7.3% | 2026 | NC | 10,750 | SH | 2.7 | % | 1 | 1 | — | 45 | $ | 238.89 | |||||||||||
8.8% | 2026 | MI | 16,486 | SH | 4.2 | % | 1 | 1 | — | 85 | $ | 193.95 | |||||||||||
9.0% | (4) | 2030 | IL | 1,177 | UDP | 0.3 | % | 1 | — | — | — | $ | — | ||||||||||
8.5% | 2030 | FL | 39,330 | SH | 10.0 | % | 1 | 1 | — | 250 | $ | 157.32 | |||||||||||
8.3% | 2030 | CA | 55,350 | SH | 14.1 | % | 1 | 2 | — | 171 | $ | 323.68 | |||||||||||
11.1% | (5) | 2043 | MI | 180,388 | SNF | 45.8 | % | 1 | 14 | 1,749 | — | $ | 103.14 | ||||||||||
10.1% | (6) | 2045 | MI | 39,700 | SNF | 10.1 | % | 1 | 4 | 480 |
| — | $ | 82.71 | |||||||||
10.5% | (6) | 2045 | MI |
| 19,650 | SNF | 5.0 | % | 1 | 2 | 201 |
| — | $ | 97.76 | ||||||||
10.8% | (6) | 2045 | MI | 14,800 | SNF | 3.8 | % | 1 | 1 | 146 | — | $ | 101.37 | ||||||||||
Total | $ | 393,587 | (1) | 100.0 | % | 10 | 27 | 2,576 |
| 663 | $ | 121.51 | |||||||||||
| (1) | Excludes the impact of the credit loss reserve. |
| (2) | Some loans contain certain guarantees and provide for certain facility fees. |
| (3) | Our mortgage loans are secured by properties located in five states with eight borrowers. |
| (4) | During 2024, we committed to fund a $26,120 mortgage loan for the construction of a 116-unit ILF, ALF and MC located in Illinois. The borrower contributed $12,300 of equity which initially funded the construction. During the third quarter of 2025, we began funding the commitment. The loan bears interest at a current rate of 9.0% and an IRR of 9.5%. |
| (5) | During the three months ended September 30, 2025, we modified the mortgage loan to increase the current interest paid by Prestige, the borrower, from 8.5% to the full contractual interest rate of 11.14% escalated annually. The modification was effective July 1, 2025. Additionally, the modification provides Prestige an option to prepay their mortgage loan at par and without penalty within a 12-month window beginning in July 2026. Prestige is required to provide us with a 90-day notice of its intention to exercise the option, and the ability for Prestige to exercise the pre-payment option is contingent on several factors including Prestige being current and in good standing on all its mortgage loans with LTC and obtaining replacement financing. In conjunction with the loan modification that provided the borrower a penalty-free early payoff option, we wrote-off $41,455 of interest receivable previously accrued related to this loan during the three months ended September 30, 2025. For more information related to the effective interest write-off see Note 3. Real Estate Investments. |
| (6) | Mortgage loans provide for 2.25% annual increases in the interest rate. |
47
Amount | ||||
Originations and funding under mortgage loans receivable | $ | 99,590 | (1) | |
Pay-offs received | (21,281) | |||
Application of interest reserve | — | |||
Scheduled principal payments received | (450) | |||
Mortgage loan premium amortization | (6) | |||
Provision for loan loss reserve | (779) | |||
Net increase in mortgage loans receivable | $ | 77,074 | ||
| (1) | Includes the following: |
| (a) | $55,350 under a $57,550 mortgage loan commitment secured by two SH with a total of 171 units in California. The loan term is five years at a rate of 8.3%; |
| (b) | $39,330 under a $42,300 mortgage loan commitment secured by a 250-unit ILF, ALF and MC in Florida. The loan term is five years at a fixed rate of 8.5%; |
| (c) | $3,733 under a $19,500 mortgage loan commitment for the construction of an 85-unit ALF and MC in Michigan. The borrower contributed $12,100 of equity upon origination in July 2023, which was used to initially fund the construction. Our remaining commitment is $3,013. The interest-only loan term is approximately three years at a rate of 8.75%, and includes two one-year extensions, each of which is contingent on certain coverage thresholds; and |
| (d) | $1,177 under a $26,120 mortgage loan commitment for the construction of the construction of a 116-unit ILF, ALF and MC located in Illinois. The borrower contributed $12,300 of equity which was used to initially fund the construction. During the third quarter of 2025, we began funding this commitment. Our remaining commitment is $24,943. The loan bears interest at a current rate of 9.0% and an IRR of 9.5%. |
Preferred Equity Investment in Unconsolidated Joint Ventures
During the nine months ended September 30, 2025, we received $16.0 million, which includes a 13% exit IRR of $3.0 million, from the redemption of our preferred equity investment in a joint venture that owns a 267-unit independent and assisted living community in Washington.
Investment in Notes Receivable
Amount | |||||
Advances under notes receivable |
| $ | 25 |
| |
Principal payments received under notes receivable | (18,039) | (1) | |||
Write-off of notes receivable | (2,693) | (2) | |||
Recovery of credit losses | 207 | ||||
Net decrease in notes receivable | $ | (20,500) | |||
| (1) | Includes the following: |
| (a) | $17,000 related to an early payoff of a mezzanine loan. In conjunction with the mezzanine loan payoff, we received exit IRR income of $2,599 recognized as Interest and other income in our Consolidated Statements of Income. The exit IRR income was partially offset by $1,624 of effective interest previously recognized over the term of the mezzanine loan through payoff; |
| (b) | $639 related to the payoff of three working capital loans; and |
| (c) | $400 related to the paydown of a working capital loan. |
| (2) | Represents the write-off of Anthem working capital note in connection with the conversion of its Triple-Net leases to SHOP. |
48
Health Care Regulatory
The Centers for Medicare & Medicaid Services (“CMS”) annually updates Medicare SNF prospective payment system rates and other policies. On July 31, 2025, CMS issued a final rule to update Medicare payment policies and rates for SNFs under the SNF prospective payment system (“SNF PPS”) for fiscal year (“FY”) 2026. CMS announced that for FY 2026, it was updating SNF PPS rates by 3.2% based on the final SNF market basket of 3.3%, plus a 0.6% market basket forecast error adjustment, and a negative 0.7% productivity adjustment, which amounts to an increase in SNF PPS payments of $1.16 billion compared to payments in FY 2025. CMS stated that its impact figures do not incorporate the SNF Value-Based Purchasing (“VBP”) reductions for certain SNFs subject to the net reduction in payments under the SNF VBP, which are estimated to total $208.36 million in FY 2026. CMS announced that it was finalizing several changes to the PDPM ICD-10-CM code mappings to allow providers to provide more accurate, consistent, and appropriate primary diagnoses that meet the criteria for skilled intervention during a Part A SNF stay. CMS finalized 34 changes to the PDPM ICD-10-CM code mappings to maintain consistency with the latest ICD-10-CM coding guidance. CMS also announced that for the SNF VBP Program, it was finalizing a series of operational and administrative proposals as part of the final rule. In addition, CMS announced that for the SNF Quality Reporting Program (“QRP”), it was finalizing its proposal to remove four standardized patient assessment data elements from the Minimum Data Set (“MDS”), the SNF resident assessment form, beginning with residents admitted on or after October 1, 2025. CMS also announced it was finalizing its proposal to amend the reconsideration request policy and process.
On April 22, 2024, CMS issued the Minimum Staffing Standards for Long-Term Care Facilities and Medicaid Institutional Payment Transparency Reporting final rule. The final rule set forth new comprehensive minimum staffing requirements. It finalized a total nurse staffing standard of 3.48 hours per resident day (“HPRD”), which must include at least 0.55 hours per resident day of direct registered nurse care and 2.45 hours per resident day of direct nurse aide care. It permitted facilities to use any combination of nurse staff (registered nurse, licensed practical nurse and licensed vocational nurse, or nurse aide) to account for the additional 0.48 hours per resident day needed to comply with the total nurse staffing standard. CMS also finalized enhanced facility assessment requirements and a requirement to have a registered nurse onsite 24 hours a day, seven days a week (“24/7”), to provide skilled nursing care. The final rule also provided a staggered implementation timeframe of the minimum nurse staffing standards and 24/7 registered nurse requirement based on geographic location as well as possible exemptions for qualifying facilities for some parts of these requirements based on workforce unavailability and other factors. The final rule was challenged in federal courts in Texas and Iowa. An April 2025 decision from the U.S. District Court for the Northern District of Texas and a June 2025 decision from the U.S. District Court for the Northern District of Iowa blocked the rule from taking effect. The Texas federal court vacated the rule in full, finding that CMS had exceeded its authority in promulgating it. Meanwhile, the Iowa federal court only vacated the 24/7 RN requirement and the minimum staffing hours requirement, while leaving the rest of the rule in place. The U.S. Department of Justice appealed the Texas federal court’s decision striking down the entire rule to the U.S. Court of Appeals for the Fifth Circuit, but that appeal was dismiss at the government’s motion on September 19, 2025. The Iowa federal court’s decision was also initially appealed to the U.S. Court of Appeals for the Eighth Circuit, however that appeal was also voluntarily dismissed on a motion by the government on October 3, 2025. Thus both federal district court rulings stand undisturbed. Regardless, however, the 2025 budget reconciliation act (also known as the “One Big Beautiful Bill Act”), signed by President Trump on July 4, 2025, imposes a 10-year moratorium on the implementation and enforcement of the entire rule. So even if a future administration seeks to re-challenge the court’s rulings at some point in the future, CMS is barred from implementing the rule until 2034 at the earliest.
49
On June 18, 2025, CMS issued a Quality, Safety and Oversight memorandum, QSO-25-NH, which outlines updates to how nursing home ratings are calculated and reported on the Nursing Home Care Compare website. According to the QSO memo, as of July 30, 2025, CMS will publish average Five Star ratings and other performance-based information for chains or affiliated entities on the Nursing Home Care Compare website. CMS will also be removing COVID-19 vaccination information from the main profile page of each nursing home effective as of the same date. CMS will also be revising the methodology used to calculate Five Star Ratings. In addition, CMS also recently announced a third extension for SNFs to submit required Medicare revalidations. Facilities now have until January 1, 2026 to submit these filings.
There can be no assurance that these rules or future regulations modifying Medicare SNF payment rates or other requirements for Medicare and/or Medicaid participation will not have an adverse effect on the financial condition of our borrowers and lessees which could, in turn, adversely impact the timing or level of their payments to us and our overall financial condition. Failure by an operator to comply with regulatory requirements can, among other things, jeopardize a facility’s compliance with the conditions of participation under relevant federal and state healthcare programs. Further the ability of our operators to comply with applicable regulations, including minimum staffing requirements, can be adversely impacted by changes in the labor market and increases in inflation.
Key Performance Indicators, Trends and Uncertainties
We utilize several key performance indicators to evaluate the various aspects of our business. These indicators are discussed below and relate to concentration risk and credit strength. Management uses these key performance indicators to facilitate internal and external comparisons to our historical operating results in making operating decisions and for budget planning purposes.
Concentration Risk. We evaluate by gross investment our concentration risk in terms of asset mix, real estate investment mix, operator mix and geographic mix. Concentration risk is valuable to understand what portion of our real estate investments could be at risk if certain sectors were to experience downturns. Asset mix measures the portion of our investments that are real property or mortgage loans. The National Association of Real Estate Investment Trusts (“NAREIT”), an organization representing U.S. REITs and publicly traded real estate companies, classifies a company with 50% or more of assets directly or indirectly in the equity ownership of real estate as an equity REIT. Investment mix measures the portion of our investments that relate to our various property classifications. Operator/credit mix measures the portion of our investments that relate to our top five operators. Geographic mix measures the portion of our real estate investment that relate to our top five states.
50
The following table reflects our recent historical trends of concentration risk (gross investment, in thousands):
9/30/25 | 6/30/25 | 3/31/25 | 12/31/24 | 9/30/24 |
| |||||||||||
Asset mix: |
|
|
|
| ||||||||||||
Owned properties-Triple-Net | $ | 1,149,924 | $ | 1,154,836 | $ | 1,329,856 | $ | 1,333,078 | $ | 1,342,188 | ||||||
Owned properties-SHOP | 446,527 | 174,847 | — | — | — | |||||||||||
Financing receivables | 362,201 | 361,438 | 361,460 | 361,482 | 361,504 | |||||||||||
Mortgage loan receivables | 393,587 | 356,815 | 317,527 | 315,734 | 364,414 | |||||||||||
Notes receivable | 27,010 | 44,135 | 44,786 | 47,717 | 48,173 | |||||||||||
Unconsolidated joint ventures | 18,342 | 17,793 | 17,602 | 30,602 | 30,602 | |||||||||||
Real estate investment mix: | ||||||||||||||||
Senior housing communities | $ | 1,440,634 | $ | 1,138,799 | $ | 1,100,232 | $ | 1,117,588 | $ | 1,165,395 | ||||||
Skilled nursing centers | 943,775 | 959,060 | 958,994 | 959,020 | 959,482 | |||||||||||
Other (1) | 12,005 | 12,005 | 12,005 | 12,005 | 12,005 | |||||||||||
Under development |
| 1,177 | — | — | — | 9,999 | ||||||||||
Operator/credit mix: | ||||||||||||||||
ALG Senior Living | $ | 296,405 | $ | 295,628 | $ | 295,629 | $ | 295,629 | $ | 307,308 | ||||||
Prestige Healthcare (1) | 268,534 | 268,567 | 268,896 | 269,022 | 269,345 | |||||||||||
Encore Senior Living | 199,187 | 196,735 | 195,355 | 195,276 | 191,988 | |||||||||||
HMG Healthcare, LLC | 167,917 | 167,202 | 166,976 | 166,716 | 166,833 | |||||||||||
Anthem Memory Care, LLC (2) | — | — | 153,714 | 156,407 | 156,407 | |||||||||||
Carespring Health Care Management, LLC | 102,940 | 102,940 | 102,940 | 102,940 | 102,940 | |||||||||||
Remaining operators (2) | 916,081 | 903,945 | 887,721 | 902,623 | 952,060 | |||||||||||
SHOP operators (2) | 446,527 | 174,847 | — | — | — | |||||||||||
Geographic mix: | ||||||||||||||||
Texas | $ | 314,232 | $ | 319,423 | $ | 318,584 | $ | 318,133 | $ | 323,737 | ||||||
North Carolina | 302,504 | 301,727 | 301,650 | 301,468 | 301,142 | |||||||||||
Michigan | 293,889 | 293,189 | 292,396 | 290,450 | 287,795 | |||||||||||
Wisconsin | 288,933 | 94,051 | 93,849 | 93,844 | 93,562 | |||||||||||
Florida | 164,697 | 168,626 | 130,152 | 130,174 | 130,196 | |||||||||||
Remaining states | 1,033,336 | 932,848 | 934,600 | 954,544 | 1,010,449 | |||||||||||
| (1) | Includes three parcels of land located adjacent to properties securing the Prestige Healthcare mortgage loan and are managed by Prestige. |
| (2) | During the second quarter of 2025, we terminated the Anthem and New Perspective Triple-Net master leases and converted the communities covered under the master leases into our SHOP segment. Additionally, during the third quarter of 2025, we acquired eight SHs within our SHOP segment. These communities within our SHOP segment operated by independent operators on our behalf are classified as “SHOP operators” during the second and third quarters of 2025. Our SHOP segment is not subject to operator/credit concentration risk. |
Credit Strength. We measure our credit strength both in terms of leverage ratios and coverage ratios. Our leverage ratios include debt to gross asset value and debt to market capitalization. The leverage ratios indicate how much of our Consolidated Balance Sheets capitalization is related to long-term obligations. Our coverage ratios include interest coverage ratio and fixed charge coverage ratio. The coverage ratios indicate our ability to service interest and fixed charges (interest). The coverage ratios are based on earnings before interest, taxes, depreciation and amortization for real estate (“EBITDAre”) as defined by NAREIT. See Non-GAAP Financial Measures below for information and reconciliation.
51
The following table reflects the recent historical trends for our credit strength measures:
Balance Sheet Metrics
Year to Date | Quarter Ended | ||||||||||||||||
9/30/25 | 9/30/25 | 6/30/25 | 3/31/25 | 12/31/24 | 9/30/24 | ||||||||||||
Debt to gross asset value | 38.1 | % | 38.1 | % | (1) | 31.3 | % | 31.1 | % | 31.1 | % | (7) | 34.5 | % | |||
Debt to market capitalization ratio | 35.1 | % | 35.1 | % | (2) | 30.4 | % | (4) | 29.5 | % | (5) | 30.3 | % | (8) | 32.3 | % | |
Interest coverage ratio (10) | 5.0 | x | 4.8 | x | (3 ) | 5.1 | x | 5.0 | x | (6) | 4.7 | x | (9) | 4.2 | x | ||
Fixed charge coverage ratio (10) | 5.0 | x | 4.8 | x | (3 ) | 5.1 | x | 5.0 | x | (6) | 4.7 | x | (9) | 4.2 | x | ||
| (1) | Increased due to increase in outstanding debt partially offset by increase in gross asset value. |
| (2) | Increased due to increase in outstanding debt partially offset by increase in market capitalization resulting from the sale of common stock under our Equity distribution Agreement as well as increase in stock price. |
| (3) | Decreased due to increase in interest expense and decrease in rental income partially offset by increase in revenue from resident fees and services and interest and other income. |
| (4) | Increased due to increase in outstanding debt and decrease in market capitalization from lower stock price. |
| (5) | Decreased due to increase in market capitalization due to increase in stock price. |
| (6) | Increased due to decrease in interest expense. |
| (7) | Decreased due to decrease in outstanding debt, partially offset by decrease in gross asset value. |
| (8) | Decreased due to decrease in outstanding debt, partially offset by decrease in market capitalization from lower stock price. |
| (9) | Increased due to decrease in interest expense and increase in rental income, partially offset by decrease in other income. |
| (10) | In calculating our interest coverage and fixed charge coverage ratios above, we use EBITDAre. See Non-GAAP Financial Measures below for information and reconciliation. |
We evaluate our key performance indicators in conjunction with current expectations to determine if historical trends are indicative of future results. Our expected results may not be achieved, and actual results may differ materially from our expectations. This may be a result of various factors, including, but not limited to
| ● | the status of the economy; |
| ● | the status of capital markets, including prevailing interest rates; |
| ● | compliance with and changes to regulations and payment policies within the health care industry; |
| ● | changes in financing terms; |
| ● | competition within the health care and seniors housing industries; |
| ● | changes in federal, state and local legislation; and |
| ● | the duration, spread and severity of a public health crises such as a pandemic. |
Management regularly monitors the economic and other factors listed above. We develop strategic and tactical plans designed to improve performance and maximize our competitive position. Our ability to achieve our financial objectives is dependent upon our ability to effectively execute these plans and to appropriately respond to emerging economic and company-specific trends.
52
Operating Results (unaudited, in thousands)
Three Months Ended |
| |||||||||
September 30, |
| |||||||||
2025 | 2024 | Difference |
| |||||||
Revenues: | ||||||||||
Rental income | $ | 27,842 | $ | 32,258 | $ | (4,416) | (1) | |||
Resident fees and services | 22,203 | — | 22,203 | (2) | ||||||
Interest income from financing receivables | 7,096 | 7,001 | 95 | |||||||
Interest income from mortgage loans | 9,856 | 10,733 | (877) | (3) | ||||||
Interest and other income | 2,293 | 5,791 | (3,498) | (4) | ||||||
Total revenues | 69,290 | 55,783 | 13,507 | |||||||
Expenses: | ||||||||||
Interest expense | 8,791 | 10,023 | 1,232 | (5) | ||||||
Depreciation and amortization | 8,987 | 9,054 | 67 | |||||||
Seniors housing operating expenses | 17,362 | — | (17,362) | (6) | ||||||
Write-off of effective interest receivable | 41,455 | — | (41,455) | (7) | ||||||
Provision for credit losses | 203 | 215 | 12 | |||||||
Transaction costs | 587 | 33 | (554) | |||||||
Triple-net lease property tax expense | 2,581 | 3,186 | 605 | |||||||
General and administrative expenses | 7,523 | 6,765 | (758) | (8) | ||||||
Total expenses | 87,489 | 29,276 | (58,213) | |||||||
Loss (gain) on sale of real estate, net | (738) | (9) | 3,663 | (10) | (4,401) | |||||
Income from unconsolidated joint ventures | 439 | 692 | (253) | |||||||
Income tax expense | (42) | — | (42) | |||||||
Net (loss) income | (18,540) | 30,862 | (49,402) | |||||||
Income allocated to non-controlling interests | (1,455) | (1,496) | 41 | |||||||
Net income attributable to LTC Properties, Inc. | (19,995) | 29,366 | (49,361) | |||||||
Income allocated to participating securities | (154) | (201) | 47 | |||||||
Net income available to common stockholders | $ | (20,149) | $ | 29,165 | $ | (49,314) | ||||
| (1) | Decreased primarily due to the conversion of 13 communities from Triple-Net to our new SHOP segment, write-off of a straight-line rent receivable balance due to an operator filing for bankruptcy and lower rent from property sales, partially offset by rent increases from fair-market rent resets, escalations and capital improvements. |
| (2) | Resident fees and services include all amounts earned from residents, based on individual resident agreements, at our SHOP communities. |
| (3) | Decreased due to $41,455 of interest receivable previously accrued related to Prestige mortgage loan and mortgage loan payoffs partially offset by mortgage loan originations and additional funding. |
| (4) | Decreased primarily due to aggregate one-time income of $4,052 received in 2024 from two former operators. |
| (5) | Decreased due to lower average outstanding balance on our revolving line of credit, scheduled principal paydowns on our senior unsecured notes and lower interest rates. |
| (6) | Represents operating expenses related to our new SHOP segment. |
| (7) | In conjunction with the Prestige mortgage loan modification that provided Prestige a penalty-free early payoff option, we wrote-off the interest receivable previously accrued related to this mortgage loan. |
| (8) | Increased primarily due to increase in incentive compensation expenses and other corporate expenses. |
| (9) | Represents the net loss on sale related to a closed facility in Texas. |
| (10) | Represents a net gain on sale of an 80-unit SH in Texas. |
53
Nine Months Ended | ||||||||||
September 30, | ||||||||||
2025 | 2024 | Difference | ||||||||
Revenues: | ||||||||||
Rental income | $ | 89,463 | $ | 97,464 | $ | (8,001) | (1) | |||
Resident fees and services | 34,153 | — | 34,153 | (2) | ||||||
Interest income from financing receivables | 21,182 | 14,661 | 6,521 | (3) | ||||||
Interest income from mortgage loans | 28,715 | 35,842 | (7,127) | (4) | ||||||
Interest and other income | 5,048 | 9,298 | (4,250) | (5) | ||||||
Total revenues | 178,561 | 157,265 | 21,296 | |||||||
Expenses: | ||||||||||
Interest expense | 24,718 | 31,971 | 7,253 | (6) | ||||||
Depreciation and amortization | 26,925 | 27,173 | 248 | |||||||
Seniors housing operating expenses | 26,781 | — | (26,781) | (7) | ||||||
Write-off of effective interest receivable | 41,455 | — | (41,455) | (8) | ||||||
Provision for credit losses | 3,642 | 942 | (2,700) | (9) | ||||||
Transaction costs | 7,734 | 679 | (7,055) | (10) | ||||||
Triple-net lease property tax expense | 8,483 | 9,816 | 1,333 | |||||||
General and administrative expenses | 22,941 | 20,016 | (2,925) | (11) | ||||||
Total expenses | 162,679 | 90,597 | (72,082) | |||||||
(Loss) gain on sale of real estate, net | (235) | (12) | 6,882 | (13) | (7,117) | |||||
Income from unconsolidated joint ventures | 4,543 | 1,739 | 2,804 | (14) | ||||||
Income tax benefit | 39 | — | 39 | |||||||
Net income | 20,229 | 75,289 | (55,060) | |||||||
Income allocated to non-controlling interests | (4,452) | (2,332) | (2,120) | (3) | ||||||
Net income attributable to LTC Properties, Inc. | 15,777 | 72,957 | (57,180) | |||||||
Income allocated to participating securities | (471) | (511) | 40 | |||||||
Net income available to common stockholders | $ | 15,306 | $ | 72,446 | $ | (57,140) | ||||
| (1) | Decreased primarily due to conversion of 13 communities from Triple-Net to our new SHOP segment, a one-time revenue received in 2024 related to the repayment of $2,377 in rent credits, write-off of a straight-line rent receivable balance due to an operator filing for bankruptcy, lower rent due to property sales and the write-off of a straight-line rent receivable and lease incentive balance in connection with the termination of two existing leases with the same operator, and combining them into a single master lease. These decreases were partially offset by rent increases from fair-market rent resets, annual escalations and amendments. |
| (2) | Resident fees and services include all amounts earned from residents, based on individual resident agreements, at our SHOP communities. |
| (3) | Increased primarily due to the exchange of two mortgage loan receivables near the end of the second quarter of 2024 for controlling interests in two newly formed JVs that are accounted for as financing receivables. |
| (4) | Decreased primarily due to explanation (3) above, write-off of Prestige interest receivable previously accrued and payoffs partially offset by additional mortgage loan funding. |
| (5) | Decreased primarily due to aggregate one-time income of $4,052 received from two former operators and receipt of insurance proceeds in 2024. |
| (6) | Decreased due to lower average outstanding balance on our revolving line of credit, scheduled principal paydowns on our senior unsecured notes and lower interest rates. |
| (7) | Represents operating expenses related to our new SHOP segment. |
| (8) | In conjunction with the Prestige mortgage loan modification that provided Prestige a penalty-free early payoff option, we wrote-off interest receivable previously accrued related to this mortgage loan. |
| (9) | Increased due to the write-off of a working capital note and the related interest receivable in connection with the transition of Triple-Net leases covering 12 properties to RIDEA. |
| (10) | Increased due to $5,971 lease termination fee paid to New Perspective upon conversion of the community covered under a Triple-Net lease into our SHOP segment and additional costs associated with the startup of new RIDEA platform. |
| (11) | Increased primarily due to one-time expenses related to an employee’s retirement and increase in incentive compensation expenses and other corporate expenses. |
| (12) | Represents the net loss on sale related to a closed facility in Texas and one SH in Oklahoma partially offset by a net gain on sale related to one SH and a parcel of land adjacent to an MC within our portfolio located in Ohio. |
54
| (13) | Represents the gain on sale of a 80-unit SH in Texas, a 110-unit SH in Wisconsin and two closed properties located in Texas, partially offset by the aggregate loss on sale of 6 SHs located in Texas (five) and Florida (one). |
| (14) | Increased due to the 13% exit IRR of $2,962 received in connection with the redemption of our preferred equity investment in a JV. |
Non-GAAP Financial Measures
A non-GAAP financial measure is defined as a numerical measure of a registrant’s historical or future financial performance, financial position or cash flows that excludes or includes amounts that are not excluded from or included in the most directly comparable measure calculated and presented in accordance with GAAP. We consider Funds from Operations (“FFO”), NOI and EBITDAre to be useful supplemental measures of our financial or operating performance.
Funds From Operations Available to Common Stockholders
FFO attributable to common stockholders, basic FFO attributable to common stockholders per share and diluted FFO attributable to common stockholders per share are supplemental measures of a REIT’s financial performance that are not defined by GAAP. Real estate values historically rise and fall with market conditions, but cost accounting for real estate assets in accordance with GAAP assumes that the value of real estate assets diminishes predictably over time. We believe that by excluding the effect of historical cost depreciation, which may be of limited relevance in evaluating current performance, FFO facilitates comparisons of operating performance between periods.
We use FFO as a supplemental performance measurement of our cash flow generated by operations. FFO does not represent cash generated from operating activities in accordance with GAAP, and is not necessarily indicative of cash available to fund cash needs and should not be considered an alternative to net income available to common stockholders.
We calculate and report FFO in accordance with the definition and interpretive guidelines issued by NAREIT. FFO, as defined by NAREIT, means net income available to common stockholders (computed in accordance with GAAP) excluding gains or losses on the sale of real estate and impairment write-downs of depreciable real estate plus real estate depreciation and amortization, and after adjustments for unconsolidated partnerships and joint ventures. Our calculation of FFO may not be comparable to FFO reported by other REITs that do not define the term in accordance with the current NAREIT definition or that have a different interpretation of the current NAREIT definition from us; therefore, caution should be exercised when comparing our FFO to that of other REITs.
55
The following table reconciles GAAP net income available to common stockholders to NAREIT FFO available to common stockholders (unaudited, amounts in thousands, except per share amounts):
Three Months Ended | Nine Months Ended | |||||||||||
September 30, | September 30, | |||||||||||
2025 | 2024 | 2025 | 2024 | |||||||||
GAAP net (loss) income available to common stockholders | $ | (20,149) | $ | 29,165 | $ | 15,306 | $ | 72,446 | ||||
Add: Depreciation and amortization | 8,987 | 9,054 | 26,925 | 27,173 | ||||||||
Add/(Less): Loss/(Gain) on sale of real estate, net | 738 | (3,663) | 235 | (6,882) | ||||||||
NAREIT FFO attributable to common stockholders | $ | (10,424) | $ | 34,556 | $ | 42,466 | $ | 92,737 | ||||
NAREIT FFO attributable to common stockholders per share: | ||||||||||||
Effect of dilutive securities: | ||||||||||||
Add: Participating securities | — | 201 | — | 511 | ||||||||
Diluted NAREIT FFO attributable to common stockholders | $ | (10,424) | $ | 34,757 | $ | 42,466 | $ | 93,248 | ||||
Weighted average shares used to calculate NAREIT FFO per share: | ||||||||||||
Shares for basic net income per share | 46,123 | 43,868 | 45,726 | 43,313 | ||||||||
Effect of dilutive securities: | ||||||||||||
Performance-based stock units | — | 526 | 381 | 526 | ||||||||
Participating securities | — | 302 | — | 294 | ||||||||
Total effect of dilutive securities | — | 828 | 381 | 820 | ||||||||
Shares for diluted FFO per share | 46,123 | 44,696 | 46,107 | 44,133 | ||||||||
Net Operating Income
Net operating income or NOI is a non-GAAP financial measure that is calculated as net income (loss) (computed in accordance with GAAP) before (i) general and administrative expenses, (ii) transaction costs, (iii) write-off of effective interest, (iv) provision for credit losses, (v) impairment loss, (vi) depreciation and amortization, (vii) interest expense, (viii) gain or loss on sale of real estate and (ix) income tax benefit or expense. We use NOI to reflect the operating performance of our portfolio because NOI excludes certain items that are not associated with the operations of our properties.
NOI is not equivalent to our net income (loss) as determined under GAAP. Additionally, our use of the term NOI may not be comparable to that of other real estate companies as they may have different methodologies for computing this amount. Therefore, caution should be exercised when comparing our NOI to that of other REITs.
The following is a reconciliation of net income or loss, which is the most directly comparable GAAP financial measure to NOI for the three and nine months ended September 30, 2025 and 2024 (in thousands):
Three Months Ended | Nine Months Ended | |||||||||||
September 30, | September 30, | |||||||||||
2025 | 2024 | 2025 | 2024 | |||||||||
Net (loss) income | $ | (18,540) | $ | 30,862 | $ | 20,229 | $ | 75,289 | ||||
Add/ (Less): Income tax expense (benefit) | 42 | — | (39) | — | ||||||||
Add/ Less : Loss (gain) on sale of real estate, net | 738 | (3,663) | 235 | (6,882) | ||||||||
Add: General and administrative expense | 7,523 | 6,765 | 22,941 | 20,016 | ||||||||
Add: Transaction costs | 587 | 33 | 7,734 | 679 | ||||||||
Add: Write-off of effective interest | 41,455 | — | 41,455 | — | ||||||||
Add: Provision for credit losses | 203 | 215 | 3,642 | 942 | ||||||||
Add: Depreciation and amortization | 8,987 | 9,054 | 26,925 | 27,173 | ||||||||
Add: Interest expense | 8,791 | 10,023 | 24,718 | 31,971 | ||||||||
NOI | $ | 49,786 | $ | 53,289 | $ | 147,840 | $ | 149,188 | ||||
56
Earnings before Interest, Taxes, Depreciation and Amortization for Real Estate
Earnings before interest, taxes, depreciation and amortization for real estate or EBITDAre is calculated as net income available to common stockholders (computed in accordance with GAAP) excluding (i) interest expense, (ii) income tax expense, (iii) real estate depreciation and amortization, (iv) impairment write-downs of depreciable real estate, (v) gains or losses on the sale of depreciable real estate, and (vi) adjustments for unconsolidated partnerships and joint ventures.
EBITDAre is not an alternative to net income, operating income or cash flows from operating activities as calculated and presented in accordance with GAAP. You should not rely on EBITDAre as a substitute for any such GAAP financial measures or consider it in isolation, for the purpose of analyzing our financial performance, financial position or cash flows. Net income is the most directly comparable GAAP measure to EBITDAre.
The following is a reconciliation of net income or loss, which is the most directly comparable GAAP financial measure to EBITDAre for the periods presented below (in thousands):
Year to Date | Three Months Ended | ||||||||||||||||||
9/30/25 | 9/30/25 | 6/30/25 | 3/31/25 | 12/31/24 | 9/30/24 | ||||||||||||||
Net income (loss) | $ | 20,229 | $ | (18,540) | $ | 16,548 | $ | 22,221 | $ | 19,590 | $ | 30,862 | |||||||
Add/Less: (Loss) gain on sale | 235 | 738 | (332) | (171) | (1,097) | (3,663) | |||||||||||||
Less/Add: Income tax (benefit) expense | (39) | 42 | (81) | — | — | — | |||||||||||||
Add: Impairment loss | — | — | — | — | 6,953 | — | |||||||||||||
Add: Interest expense | 24,718 | 8,791 | 8,014 | 7,913 | 8,365 | 10,023 | |||||||||||||
Add: Depreciation and amortization | 26,925 | 8,987 | 8,776 | 9,162 | 9,194 | 9,054 | |||||||||||||
EBITDAre | 72,068 | 18 | 32,925 | 39,125 | 43,005 | 46,276 | |||||||||||||
Add/(Less) : Non-recurring one-time items | 50,834 | (1) | 42,418 | (2) | 8,011 | (3) | 405 | (4) | (3,379) | (5) | (4,173) | (6) | |||||||
Adjusted EBITDAre | $ | 122,902 | $ | 42,436 | $ | 40,936 | $ | 39,530 | $ | 39,626 | $ | 42,103 | |||||||
Interest expense | $ | 24,718 | $ | 8,791 | $ | 8,014 | $ | 7,913 | $ | 8,365 | $ | 10,023 | |||||||
Interest coverage ratio | 5.0 | x | 4.8 | x | 5.1 | x | 5.0 | x | 4.7 | x | 4.2 | x | |||||||
Interest expense | $ | 24,718 | $ | 8,791 | $ | 8,014 | $ | 7,913 | $ | 8,365 | $ | 10,023 | |||||||
Total fixed charges | $ | 24,718 | $ | 8,791 | $ | 8,014 | $ | 7,913 | $ | 8,365 | $ | 10,023 | |||||||
Fixed charge coverage ratio | 5.0 | x | 4.8 | x | 5.1 | x | 5.0 | x | 4.7 | x | 4.2 | x | |||||||
| (1) | See (2), (3) and (4) below for explanation. |
| (2) | Includes $41,455 effective interest write-off related to a mortgage loan amendment that permits penalty-free early payoff window within an allowable window, $1,271 straight-line rent receivable write-off due to an operator’s bankruptcy filing, $554 provision for credit losses related to mortgage loan originations and $488 of one-time transaction costs in connection with the transition to RIDEA partially offset by the exit IRR of $975 received in connection with an early payoff of a mezzanine loan and recovery of credit losses of $375 related to loan payoffs. |
| (3) | Includes $5,971termination fee paid to New Perspective, $1,136 one-time costs associated with an employee’s retirement, $520 of one-time RIDEA transaction costs and $384 provision for credit losses related to a mortgage loan origination. |
| (4) | Includes $2,693 write-off of a working capital note, $371 of related interest receivable, and $303 of one-time transaction costs, all in connection with the transition to RIDEA, partially offset by the 13% exit IRR of $2,962 received in connection with the redemption of our preferred equity investment in a JV. |
| (5) | Includes a one-time additional straight-line income of $3,158 related to restoring accrual basis accounting for two master leases, recovery of credit losses of $511 related to a mortgage loan receivable write-off, partially offset by $290 provision for credit losses related to the write-off of an uncollectible loan receivable. |
| (6) | Includes an aggregate one-time income of $4,493 received from three former operators, the recovery of provisions for credit losses of $293 related to a mortgage loan receivable payoff, partially offset by the uncollectible effective interest write-off of $613 of interest receivable related to the partial paydown of a mortgage loan receivable. |
57
Liquidity and Capital Resources
Sources and Uses of Cash
As of September 30, 2025, we had $400.0 million in liquidity as follows (amounts in thousands, except per share amounts):
At September 30, 2025 | |||
Cash and cash equivalents | $ | 17,933 | |
Available under unsecured revolving line of credit | 51,550 | (1) | |
Available under Equity Distribution Agreement | 330,271 | (2) | |
Total Liquidity | $ | 399,754 | (3) |
| (1) | Subsequent to September 30, 2025, we repaid $62,900 under our new revolving line of credit. Accordingly, we have $485,550 outstanding and $114,450 available for borrowing under our unsecured revolving line of credit. |
| (2) | Subsequent to September 30, 2025, we sold 281,400 shares of common stock under our Equity Distribution Agreement. Accordingly, we had $319,881 available under the Equity Distribution Agreement. |
| (3) | Subsequent to September 30, 2025, we had $452,264 in liquidity. See (1) and (2) above. |
We believe that our current cash balance, cash flow from operations available for distribution or reinvestment, our borrowing capacity and our potential ability to access the capital markets are sufficient to provide for payment of our current operating costs, meet debt obligations and pay common dividends at least sufficient to maintain our REIT status and repay borrowings at, or prior to, their maturity. The timing, source and amount of cash flows used in financing and investing activities are sensitive to the capital markets environment, especially to changes in interest rates. In addition inflation may adversely affect our operators’ business, results of operations, cash flows and financial condition which could, in turn, adversely affect our financial position.
The operating results of the facilities will be impacted by various factors over which the operators/owners may have no control. Those factors include, without limitation, the health of the economy, inflation pressures, employee availability and cost, changes in supply of or demand for competing seniors housing and health care facilities, ability to hire and maintain qualified staff, ability to control other rising operating costs, and the potential for significant reforms in the health care industry and related occupancy challenges in the governmental regulations and financing of the health care industry or the impact of any other infectious disease and epidemic outbreaks. We cannot presently predict what impact these potential events may have, if any. We believe that adequate provision has been made for the possibility of loans proving uncollectible but we will continually evaluate the financial condition of the operations of our seniors housing and health care properties. In addition, we will monitor our borrowers and the underlying collateral for mortgage loans and will make future revisions to the provision, if considered necessary.
Depending on our borrowing capacity, compliance with financial covenants, ability to access the capital markets, and the payment of dividends may be negatively impacted. We continuously evaluate the availability of cost-effective capital and believe we have sufficient liquidity for our current dividend, corporate expenses and additional capital investments in 2025 and 2026.
Our investments, principally our investments in owned properties, financing receivables and mortgage loans, are subject to the possibility of loss of their carrying values as a result of changes in market prices, interest rates and inflationary expectations. The effects on interest rates may affect our costs of financing our operations and the fair-market value of our financial assets. Generally, our leases have agreed upon annual increases and our loans have predetermined increases in interest rates. Inasmuch
58
as we may initially fund some of our investments with variable interest rate debt, we would be at risk of net interest margin deterioration if medium and long-term rates were to increase.
Our primary sources of cash include rent, resident fees and services, interest receipts, borrowings under our unsecured credit facility, public and private issuances of debt and equity securities, proceeds from investment dispositions and principal payments on loans receivable. Our primary uses of cash include dividend distributions, debt service payments (including principal and interest), seniors housing operating expenses, property tax expenses, real property investments (including acquisitions, capital expenditures and construction advances), loan advances and general and administrative expenses. These sources and uses of cash are reflected in our Consolidated Statements of Cash Flows as summarized below (in thousands):
Nine Months Ended September 30, | Change | |||||||||
Net cash provided by (used in): | 2025 | 2024 | $ | |||||||
Operating activities | $ | 98,038 | $ | 91,998 | $ | 6,040 | ||||
Investing activities | (317,100) | 40,379 | (357,479) | |||||||
Financing activities | 227,581 | (117,623) | 345,204 | |||||||
Increase in cash and cash equivalents | 8,519 | 14,754 | (6,235) | |||||||
Cash and cash equivalents, beginning of period | 9,414 | 20,286 | (10,872) | |||||||
Cash and cash equivalents, end of period | $ | 17,933 | $ | 35,040 | $ | (17,107) | ||||
Debt Obligations
Unsecured Credit Facility. We had an unsecured credit agreement (the “Credit Agreement”) that provided for an aggregate commitment of the lenders of up to $525.0 million comprised of a $425.0 million revolving credit facility (the “Revolving Line of Credit”) and two $50.0 million term loans (the “Term Loans”). The Term Loans had maturities of November 19, 2025 and November 19, 2026. The Revolving Line of Credit has a maturity date of November 19, 2026. The Credit Agreement permitted us to request increases to the Revolving Line of Credit and Term Loans commitments up to a total of $1.0 billion.
During the third quarter of 2025, we entered into a new four-year unsecured credit agreement (“New Credit Agreement”) maturing in July 2029, to replace our previous Credit Agreement. The New Credit Agreement increased the aggregate commitment on our revolving line of credit from $425.0 million to $600.0 million and provides for the opportunity to increase the total commitment to an aggregate of $1.2 billion. The New Credit Agreement provides for a one-year extension option, subject to customary conditions. Material terms of the New Credit Agreement remain unchanged. In connection with the New Credit Agreement, the Term Loans were rolled into the new revolving line of credit, keeping the interest rate swap agreements intact at an average 2.3% rate, based on current margins. Based on our leverage at September 30, 2025, the facility provides for interest annually at SOFR plus 115 basis points and a facility fee of 20 basis points.
Interest Rate Swap Agreements. In connection with entering into the Term Loans as described above, we entered into two receive variable/pay fixed interest rate swap agreements (the “Interest Rate Swaps”) with maturities of November 19, 2025 and November 19, 2026, respectively, that effectively locked in the forecasted interest payments on the Term Loans’ borrowings over their four and five year terms of the loans. The Interest Rate Swaps are considered cash flow hedges and are recorded on our Consolidated Balance Sheets at fair value, with changes in the fair value of these instruments recognized in Accumulated other comprehensive income (loss) on our Consolidated Balance Sheets. During the three and nine months ended September 30, 2025, we recorded a decrease of $0.7 million and $2.4 million in fair value of Interest Rate Swaps, respectively. As discussed above, during the third quarter of 2025, Term Loans were paid off using proceeds from our new revolving line of credit under our New Credit
59
Agreement, keeping the Interest Rate Swaps intact through November 2025 at 2.3% and November 2026 at 2.4%, based on current margins.
As of September 30, 2025, the terms of the Interest Rate Swaps are as follows (dollar amounts in thousands):
Notional | Fair Value at | |||||||||||||
Date Entered | Maturity Date | Swap Rate | Rate Index | Amount | September 30, 2025 | |||||||||
November 2021 | November 19, 2025 | 2.52 | % | 1-month SOFR | $ | 50,000 | $ | 200 | ||||||
November 2021 | November 19, 2026 | 2.66 | % | 1-month SOFR | 50,000 | 1,259 | ||||||||
$ | 100,000 | $ | 1,459 | |||||||||||
Senior Unsecured Notes. We have senior unsecured notes held by institutional investors with interest rates ranging from 3.66% to 4.50%. The senior unsecured notes mature between 2026 and 2033.
The senior unsecured notes and the Credit Agreement, contain financial covenants, which are measured quarterly, that require us to maintain, among other things:
| ● | a ratio of total indebtedness to total asset value not greater than 0.6 to 1.0; |
| ● | a ratio of secured debt to total asset value not greater than 0.35 to 1.0; |
| ● | a ratio of unsecured debt to the value of the unencumbered asset value not greater than 0.6 to 1.0; and |
| ● | a ratio of EBITDA, as calculated in the debt obligation, to fixed charges not less than 1.50 to 1.0. |
At September 30, 2025, we were in compliance with all applicable financial covenants. These debt obligations also contain additional customary covenants and events of default that are subject to a number of important and significant limitations, qualifications and exceptions.
The debt obligations by component as of September 30, 2025 are as follows (dollar amounts in thousands):
Applicable | Available | |||||||
Interest | Outstanding | for | ||||||
Debt Obligations | Rate (1) | Balance | Borrowing | |||||
Revolving line of credit (2) | 4.76% | $ | 548,450 | $ | 51,550 | |||
Senior unsecured notes, net of debt issue costs | 4.12% | 396,065 | — | |||||
Total | 4.49% | $ | 944,515 | $ | 51,550 | |||
| (1) | Represents weighted average interest rate as of September 30, 2025. |
| (2) | Subsequent to September 30, 2025, we repaid $62,900 under our new revolving line of credit. Accordingly, we have $485,550 outstanding and $114,450 available for borrowing under our unsecured revolving line of credit. |
60
During the nine months ended September 30, 2025, our debt borrowings and repayments were as follows (in thousands):
Debt Obligations | Borrowings | Repayments | |||||
Revolving line of credit | $ | 433,500 | (1) | $ | (29,400) | ||
Term loans | — | (100,000) | |||||
Senior unsecured notes | — | (44,500) | |||||
Total | $ | 433,500 | $ | (173,900) |
| (1) | Subsequent to September 30, 2025, we repaid $62,900 under our new revolving line of credit. Accordingly, we have $485,550 outstanding and $114,450 available for borrowing under our unsecured revolving line of credit. |
Equity
At September 30, 2025, we had 47,332,792 shares of common stock outstanding, total equity on our balance sheet $1.0 billion and our equity securities had a market value of $1.7 billion. During the nine months ended September 30, 2025, we declared and paid $80.0 million of cash dividends.
During the nine months ended September 30, 2025, we acquired 151,018 shares of common stock held by employees who tendered owned shares to satisfy tax withholding obligations.
Subsequent to September 30, 2025, we declared a monthly cash dividend of $0.19 per share on our common stock for the months of October, November and December 2025, payable on October 31, November 28, and December 31, 2025, respectively, to stockholders of record on October 23, November 20, and December 23, 2025, respectively.
At-The-Market Program. We have an equity distribution agreement (the “Equity Distribution Agreement”) to offer and sell, from time to time, up to $400.0 million in aggregate offering price of shares of our common stock. The Equity Distribution Agreement provides for sales of common shares to be made by means of ordinary brokers’ transactions, which may include block trades, or transactions that are deemed to be “at the market” offerings.
During the nine months ended September 30, 2025, we sold 1,655,100 shares of common stock for $59.3 million in net proceeds under our Equity Distribution Agreement. In conjunction with the sale of common stock, we incurred $353,000 of costs associated with this agreement which have been recorded in additional paid in capital as a reduction of proceeds received. At September 30, 2025, we had $330.3 million available under the Equity Distribution Agreement.
Available Shelf Registrations. We have an automatic shelf registration statement on file with the SEC and currently have the ability to file additional automatic shelf registration statements to provide us with capacity to publicly offer an indeterminate amount of common stock, preferred stock, warrants, debt, depositary shares, or units. We may from time to time raise capital under our automatic registration statement in amounts, at prices, and on terms to be announced when and if the securities are offered. The specifics of any future offerings, along with the use of proceeds of any securities offered, will be described in detail in a prospectus supplement, or other offering materials, at the time of the offering. Our shelf registration statement expires in November 2027.
Stock-Based Compensation. During the second quarter of 2021, we adopted and our shareholders approved the 2021 Equity Participation Plan (“the 2021 Plan”) which replaces the 2015 Equity Participation Plan (“the 2015 Plan”). Under the 2021 Plan, 1,900,000 shares of common stock have been authorized and reserved for awards, less one share for every one share that was subject to an award granted under the 2015 Plan after December 31, 2020 and prior to adoption. In addition, any shares that
61
are not issued under outstanding awards under the 2015 Plan because the shares were forfeited or cancelled after December 31, 2020 will be added to and again be available for awards under the 2021 Plan. Under the 2021 Plan, the shares were authorized and reserved for awards to officers, employees, non-employee directors and consultants. The terms of the awards granted under the 2021 Plan and the 2015 Plan are set by our compensation committee at its discretion. Beginning in the first quarter of 2024, we entered into Performance Stock Unit Award Agreements, based upon absolute and relative total shareholder return, under the 2021 Plan.
During the nine months ended September 30, 2025, 165,549 shares of restricted stock and 182,915 performance-based stock units vested. During the nine months ended September 30, 2025, we awarded restricted stock and performance-based stock units as follows:
No. of | Price per | ||||||
Shares | Share | Award Type | Vesting Period | ||||
113,790 | $ | 34.88 | Restricted stock | ratably over 3 years | |||
5,626 | $ | 35.55 | Restricted stock | April 30, 2028 | |||
15,625 | $ | 35.20 | Restricted stock | (1) | |||
52,666 | $ | 34.88 | Performance-based stock units | TSR targets (2) | |||
48,535 | $ | 34.88 | Performance-based stock units | TSR targets (3) | |||
236,242 | |||||||
| (1) | Vesting date is the earlier of the one-year anniversary of the award date and the date of the next annual meeting of the stockholders of LTC following the award date. |
| (2) | Vesting is based on achieving certain total shareholder return (“TSR”) targets in 3 years. |
| (3) | Vesting is based on achieving certain TSR targets relative to the TSR of a predefined peer group in 3 years. |
Critical Accounting Policies
Our consolidated financial statements included in Part I, Item 1 of this Quarterly Report on Form 10-Q are prepared in conformity with U.S. generally accepted accounting principles for interim financial information set forth in the Accounting Standards Codification as published by the Financial Accounting Standards Board, which require us to make estimates and assumptions regarding future events that affect the amounts reported in our financial statements and accompanying footnotes. We base these estimates on our experience and assumptions regarding future events we believe to be reasonable under the circumstances. Actual results could differ from those estimates and such differences may be material to the consolidated financial statements. We have described our most critical accounting policies in the “Management’s Discussion and Analysis of Financial Condition and Results of Operations” section of our Annual Report on Form 10-K for the year ended December 31, 2024. There have been no material changes to our critical accounting policies or estimates since December 31, 2024.
Item 3. QUANTITATIVE AND QUALITATIVE DISCLOSURES ABOUT MARKET RISK
There were no material changes in our market risk during the nine months ended September 30, 2025. For additional information, refer to Item 7A as presented in our Annual Report on Form 10-K for the year ended December 31, 2024.
Item 4. CONTROLS AND PROCEDURES
Our management, with the participation of our Co-Chief Executive Officers and Chief Financial Officer, evaluated the effectiveness of our disclosure controls and procedures (as such term is defined in Rules 13a-15(e) and 15d-15(e) under the Exchange Act) as of the end of the period covered by this report. Based on such evaluation our Co-Chief Executive Officers and Chief Financial Officer concluded that, as of the end of the period covered by this report, our disclosure controls and procedures were effective.
62
There has not been any change in our internal control over financial reporting identified in connection with the evaluation required by Rules 13a-15d and 15d-15(d) under the Exchange Act that occurred during the period covered by this report that has materially affected, or is reasonably likely to materially affect, our internal control over financial reporting.
PART II -- OTHER INFORMATION
Item 1. LEGAL PROCEEDINGS
We are and may become from time to time a party to various claims and lawsuits arising in the ordinary course of business, which in our opinion are not singularly or in the aggregate anticipated to be material to our results of operations or financial condition. Claims and lawsuits may include matters involving general or professional liability asserted against the lessees or borrowers related to our properties, which we believe under applicable legal principles are not our responsibility as a non-possessory landlord or mortgage holder. We believe that these matters are the responsibility of our lessees and borrowers pursuant to general legal principles and pursuant to insurance and indemnification provisions in the applicable leases or mortgages. We intend to continue to vigorously defend such claims and lawsuits.
Item 1A. RISK FACTORS
The additional risk factors below should be read in conjunction with the risk factors set forth in our Annual Report on Form 10-K for the fiscal year ended December 31, 2024.
Changes in federal, state, or local laws limiting REIT investments in the health care sector may adversely impact our ability to participate in the ownership of and investment in health care real estate.
Legislation potentially impacting REIT ownership and investment in the health care sector has recently been introduced or is under discussion at the federal and state level. These legislative proposals range from additional oversight to prohibitions on investors acquiring or increasing ownership, or operational or financial control, in a nursing home. Such legislation or similar laws or regulations, if enacted, may limit our opportunities to participate in the ownership of, or investment in, health care real estate. Changes in federal, state, or local laws or regulations limiting REIT investment in the health care sector, reducing health care related benefits for REITs, or requiring additional approvals for health care entities to do business with REITs, could have a material adverse effect on our financial condition and operations.
We are responsible for, and our financial performance will be impacted by, additional operational and legal risks and liabilities under our new SHOP segment.
During the second quarter of 2025, we began utilizing a structure, as authorized by the REIT Investment Diversification and Empowerment Act of 2007, commonly referred to as “RIDEA”. Under RIDEA, a REIT may lease a qualified healthcare property on an arm's-length basis to a taxable REIT subsidiary ("TRS") if the property is operated on behalf of such TRS by a person/entity who qualifies as an “eligible independent operator.” Under this structure, the eligible operator receives a management fee from our TRS for operating the property as an independent third party.
Properties in our new RIDEA structure are included in our seniors housing operating portfolio (“SHOP”) segment. During the second quarter of 2025, we terminated the Anthem Memory Care, LLC and New Perspective Senior Living, LLC triple-net master leases and converted 12 memory care and one independent and assisted living communities covered under the master leases to our new SHOP segment.
63
Additionally, during the third quarter of 2025, we acquired eight seniors housing communities within our SHOP segment. We may in the future acquire or transition other properties to a third-party manager using the RIDEA structure in our SHOP segment. There can be no assurance these transitions will improve performance of the properties, and they will also increase our exposure to risks associated with operating in this structure.
As the owner of a property under a RIDEA structure, we are responsible for, and our financial performance is impacted by, operational and legal risks and liabilities of the property. Although we have some general oversight approval rights and the right to review operational and financial reporting information with respect to a typical RIDEA structure, our independent third-party operators ultimately control of the day-to-day business of the property. We rely on the personnel, expertise, technical resources and information systems, proprietary information, good faith, and judgment of our independent third party operators to set appropriate resident fees, provide accurate property-level financial results for our properties in a timely manner and to otherwise operate properties in our SHOP segment in compliance with the terms of our management agreements and all applicable laws and regulations. The income we generate from RIDEA structures in our SHOP segment is subject to a number of operational risks including fluctuations in occupancy levels and resident fee levels, increases in the cost of food, materials, energy, labor or other services, national and regional economic conditions, the imposition of new or increased taxes and regulation, capital expenditure requirements, professional and general liability claims, and the availability and cost of professional and general liability insurance.
Except as described in this Item 1A, there have been no other known material changes from the risk factors since December 31, 2024.
64
Item 2. UNREGISTERED SALES OF EQUITY SECURITIES AND USE OF PROCEEDS
None
Item 5. OTHER INFORMATION
Insider Trading Arrangements
During the nine months ended September 30, 2025,
65
Item 6. EXHIBITS
3.1 | |
3.2 | |
10.1 | |
31.1 | |
31.2 | |
31.3 | |
32 | |
101.INS | Inline XBRL Instance Document - the instance document does not appear in the Interactive Data File because its XBRL tags are embedded within the Inline XBRL document. |
101.SCH | Inline XBRL Taxonomy Extension Schema Document |
101.CAL | Inline XBRL Taxonomy Extension Calculation Linkbase Document |
101.DEF | Inline XBRL Taxonomy Extension Definitions Linkbase Document |
101.LAB | Inline XBRL Taxonomy Extension Label Linkbase Document |
101.PRE | Inline XBRL Taxonomy Extension Presentation Linkbase Document |
104 | Cover Page Interactive Data File (formatted as Inline XBRL and contained in Exhibit 101) |
66
SIGNATURES
Pursuant to the requirements of the Securities Exchange Act of 1934, the registrant has duly caused this report to be signed on its behalf by the undersigned, thereunto duly authorized.
LTC PROPERTIES, INC. | ||
Registrant | ||
Dated: November 4, 2025 | By: | /s/ Caroline Chikhale |
Caroline Chikhale | ||
Executive Vice President, Chief Financial | ||
(Principal Financial Officer) | ||
67