EX-99.2
Published on August 4, 2025
|
RENEWAL AND TRANSITION SUPPLEMENTAL OPERATING AND FINANCIAL DATA SECOND QUARTER 2025 |
|
2Q 2025 SUPPLEMENTAL REPORT INVESTMENTS 3 Seniors Housing Operating Portfolio ("SHOP") Conversions & Investments Mortgage Loans Joint Ventures Purchase Options PORTFOLIO 7 Overview Diversification - Geography Seniors Housing Operating Portfolio ("SHOP") Diversification Real Estate Investments (Excluding SHOP) Diversification - Operators Real Estate Investments (Excluding SHOP) - Maturity Real Estate Investments (Excluding SHOP) - Metrics FINANCIAL 16 Enterprise Value Debt Metrics Debt Maturity Financial Data Summary Consolidated Statements of Income Consolidated Balance Sheets Funds from Operations GLOSSARY 27 FORWARD-LOOKING STATEMENTS 29 AND NON-GAAP INFORMATION 2 LEADERSHIP Any opinions, estimates, or forecasts regarding LTC’s performance made by the analysts listed above do not represent the opinions, estimates, and forecasts of LTC or its management. BOARD OF DIRECTORS ANALYSTS LTC PROPERTIES, INC. 3011 Townsgate Road, Suite 220 Westlake Village, CA 91361 805-981-8655 www.LTCreit.com TRANSFER AGENT Broadridge Shareholder Services c/o Broadridge Corporate Issuer Solutions 1155 Long Island Avenue Edgewood, NY 11717-8309 ATTN: IWS 866-708-5586 WENDY SIMPSON Executive Chairman CORNELIA CHENG Sustainability and Corporate Responsibility Committee Chairman DAVID GRUBER Investment Committee Chairman JEFFREY HAWKEN Compensation Committee Chairman BRADLEY PREBER Audit Committee Chairman TIMOTHY TRICHE, MD Lead Independent Director and Nominating & Corporate Governance Committee Chairman JUAN SANABRIA BMO Capital Markets Corp. AARON HECHT Citizens Bank OMOTAYO OKUSANYA Deutsche Bank Securities Inc. JOE DICKSTEIN Jefferies LLC AUSTIN WURSCHMIDT KeyBanc Capital Markets, Inc. MICHAEL CARROLL RBC Capital Markets Corp. JAY KORNREICH Wedbush JOHN KILICHOWSKI Wells Fargo Securities, LLC WENDY SIMPSON Executive Chairman PAM KESSLER Co-President and Co-CEO CLINT MALIN Co-President and Co-CEO CECE CHIKHALE EVP, Chief Financial Officer, Treasurer and Secretary DAVID BOITANO EVP, Chief Investment Officer GIBSON SATTERWHITE EVP, Asset Management MIKE BOWDEN SVP, Investments MANDI HOGAN SVP, Marketing TABLE OF CONTENTS CONTACT INFORMATION |
|
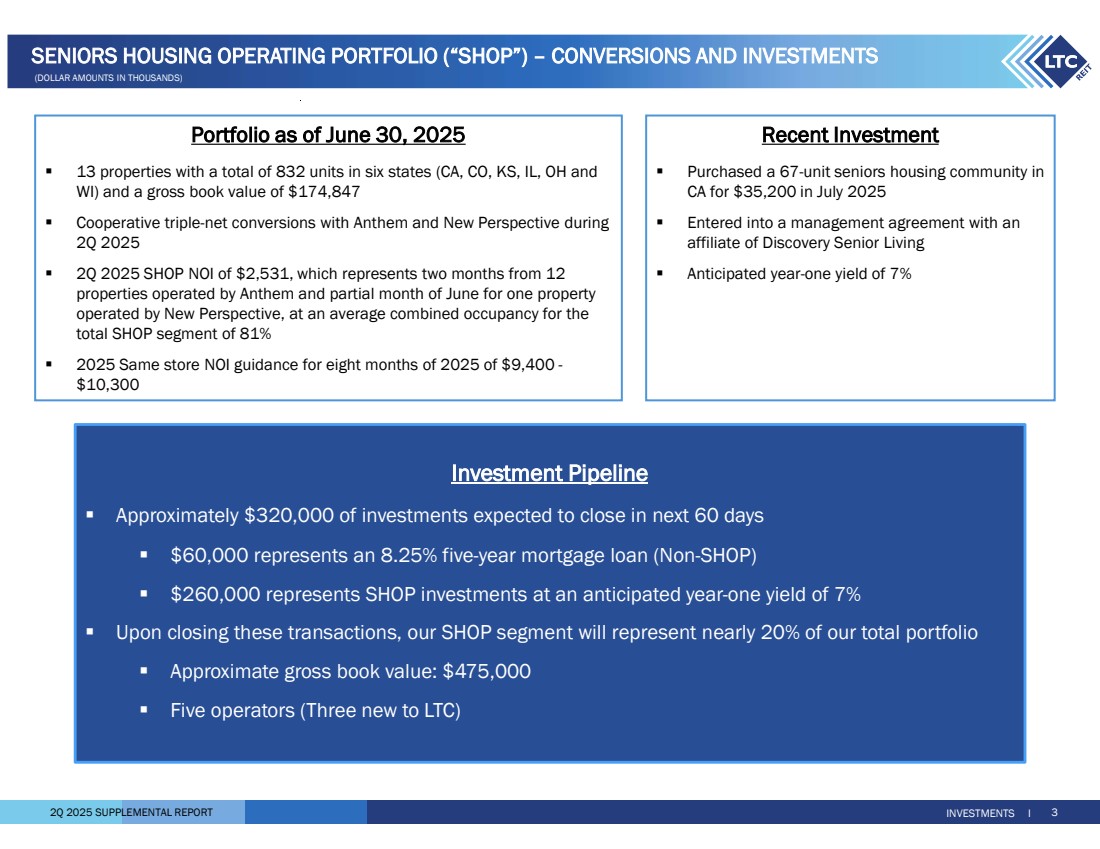
2Q 2025 SUPPLEMENTAL REPORT INVESTMENTS I 3 SENIORS HOUSING OPERATING PORTFOLIO (“SHOP”) – CONVERSIONS AND INVESTMENTS (DOLLAR AMOUNTS IN THOUSANDS) Portfolio as of June 30, 2025 13 properties with a total of 832 units in six states (CA, CO, KS, IL, OH and WI) and a gross book value of $174,847 Cooperative triple-net conversions with Anthem and New Perspective during 2Q 2025 2Q 2025 SHOP NOI of $2,531, which represents two months from 12 properties operated by Anthem and partial month of June for one property operated by New Perspective, at an average combined occupancy for the total SHOP segment of 81% 2025 Same store NOI guidance for eight months of 2025 of $9,400 - $10,300 Recent Investment Purchased a 67-unit seniors housing community in CA for $35,200 in July 2025 Entered into a management agreement with an affiliate of Discovery Senior Living Anticipated year-one yield of 7% Investment Pipeline Approximately $320,000 of investments expected to close in next 60 days $60,000 represents an 8.25% five-year mortgage loan (Non-SHOP) $260,000 represents SHOP investments at an anticipated year-one yield of 7% Upon closing these transactions, our SHOP segment will represent nearly 20% of our total portfolio Approximate gross book value: $475,000 Five operators (Three new to LTC) |
|
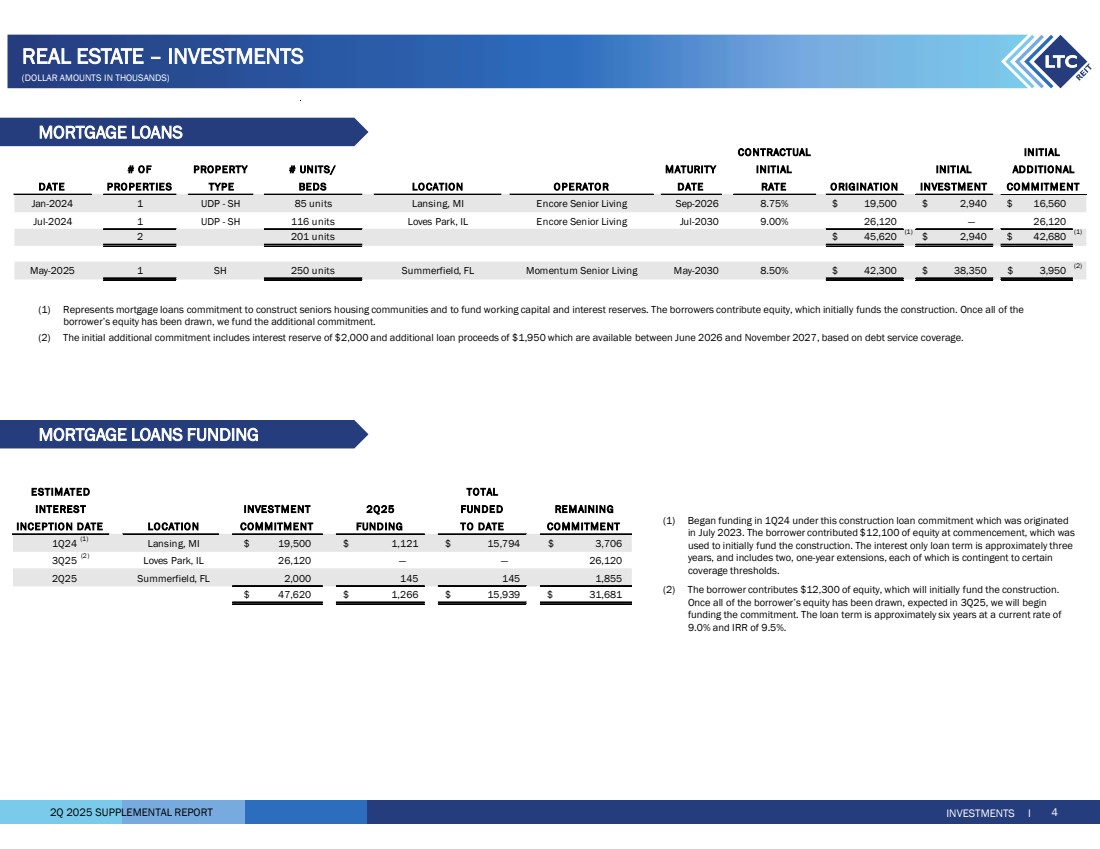
2Q 2025 SUPPLEMENTAL REPORT TOTAL INVESTMENT 2Q25 FUNDED REMAINING LOCATIO N TO DATE CO MMITME NT 1Q24 (1) Lansing, MI 19,500 $ 1,121 $ 15,794 $ 3,706 $ 3Q25 (2) Loves Park, IL 26,120 — — 26,120 2Q25 Summerfield, FL 2,000 145 145 1,855 $ 1,266 47,620 $ 15,939 $ 31,681 $ INCEPTIO N DATE COMMITME NT FUNDING INTEREST ESTIMATED MORTGAGE LOANS INVESTMENTS I 4 # OF PROPERTY # UNITS/ MATURITY INITIAL PRO PERTIES TYPE BEDS LO CATION OPERATO R DATE O RIGINATIO N INVESTME NT 1 UDP - SH 85 units Lansing, MI Encore Senior Living Sep-2026 8.75% 19,500 $ 2,940 $ 16,560 $ 1 UDP - SH 116 units Loves Park, IL Encore Senior Living Jul-2030 9.00% 26,120 — 26,120 2 201 units 45,620 $ (1) $ 42,680 2,940 $ (1) 1 SH 250 units Summerfield, FL Momentum Senior Living May-2030 8.50% 42,300 $ 38,350 $ 3,950 $ (2) CONTRACTUAL INITIAL Jan-2024 Jul-2024 COMMITMENT INITIAL ADDITIONAL RATE May-2025 DATE (1) Represents mortgage loans commitment to construct seniors housing communities and to fund working capital and interest reserves. The borrowers contribute equity, which initially funds the construction. Once all of the borrower’s equity has been drawn, we fund the additional commitment. (2) The initial additional commitment includes interest reserve of $2,000 and additional loan proceeds of $1,950 which are available between June 2026 and November 2027, based on debt service coverage. REAL ESTATE – INVESTMENTS (DOLLAR AMOUNTS IN THOUSANDS) (1) Began funding in 1Q24 under this construction loan commitment which was originated in July 2023. The borrower contributed $12,100 of equity at commencement, which was used to initially fund the construction. The interest only loan term is approximately three years, and includes two, one-year extensions, each of which is contingent to certain coverage thresholds. (2) The borrower contributes $12,300 of equity, which will initially fund the construction. Once all of the borrower’s equity has been drawn, expected in 3Q25, we will begin funding the commitment. The loan term is approximately six years at a current rate of 9.0% and IRR of 9.5%. MORTGAGE LOANS FUNDING |
|
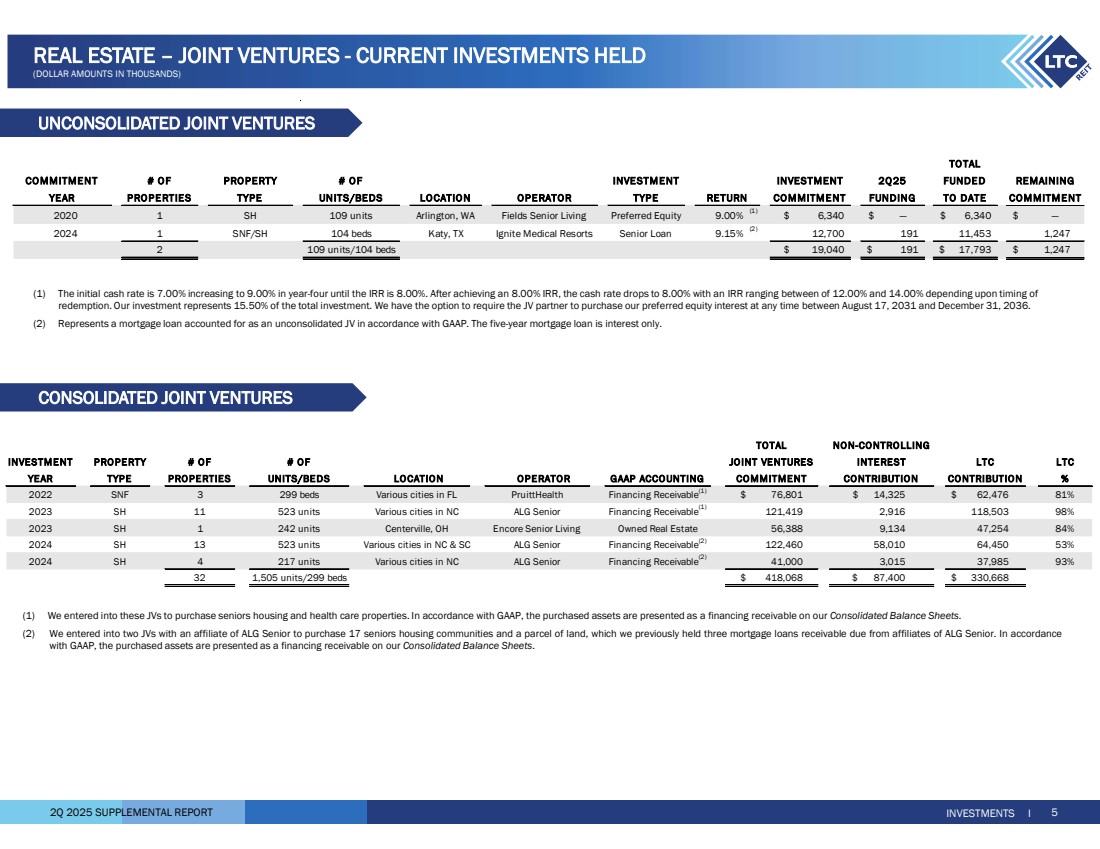
2Q 2025 SUPPLEMENTAL REPORT (1) The initial cash rate is 7.00% increasing to 9.00% in year-four until the IRR is 8.00%. After achieving an 8.00% IRR, the cash rate drops to 8.00% with an IRR ranging between of 12.00% and 14.00% depending upon timing of redemption. Our investment represents 15.50% of the total investment. We have the option to require the JV partner to purchase our preferred equity interest at any time between August 17, 2031 and December 31, 2036. (2) Represents a mortgage loan accounted for as an unconsolidated JV in accordance with GAAP. The five-year mortgage loan is interest only. CONSOLIDATED JOINT VENTURES UNCONSOLIDATED JOINT VENTURES INVESTMENTS I 5 REAL ESTATE – JOINT VENTURES - CURRENT INVESTMENTS HELD (DOLLAR AMOUNTS IN THOUSANDS) (1) We entered into these JVs to purchase seniors housing and health care properties. In accordance with GAAP, the purchased assets are presented as a financing receivable on our Consolidated Balance Sheets. (2) We entered into two JVs with an affiliate of ALG Senior to purchase 17 seniors housing communities and a parcel of land, which we previously held three mortgage loans receivable due from affiliates of ALG Senior. In accordance with GAAP, the purchased assets are presented as a financing receivable on our Consolidated Balance Sheets. INVESTMENT PROPERTY # OF # OF LTC YEAR TYPE PROPERTIES UNITS/BEDS LOCATION OPERATOR GAAP ACCOUNTING % 2022 SNF 3 299 beds Various cities in FL PruittHealth Financing Receivable(1) $ 14,325 76,801 $ 62,476 $ 81% 2023 SH 11 523 units Various cities in NC ALG Senior Financing Receivable(1) 2,916 121,419 118,503 98% 2023 SH 1 242 units Centerville, OH Encore Senior Living Owned Real Estate 56,388 9,134 47,254 84% 2024 SH 13 523 units Various cities in NC & SC ALG Senior Financing Receivable(2) 58,010 122,460 64,450 53% 2024 SH 4 217 units Various cities in NC ALG Senior Financing Receivable(2) 3,015 41,000 37,985 93% 32 1,505 units/299 beds 418,068 $ 87,400 $ 330,668 $ TOTAL NON-CONTROLLING JOINT VENTURES INTEREST LTC COMMITMENT CONTRIBUTION CONTRIBUTION TO TAL # OF PROPERTY # OF INVESTMENT 2Q25 FUNDED PROPERTIES TYPE UNITS/BEDS LOCATION OPERATOR TYPE FUNDING TO DATE 2020 1 SH 109 units Arlington, WA Fields Senior Living Preferred Equity 9.00% (1) $ — 6,340 $ 6,340 $ — $ 2024 1 SNF/SH 104 beds Katy, TX Ignite Medical Resorts Senior Loan 9.15% (2) 191 12,700 11,453 1,247 2 109 units/104 beds 19,040 $ 191 $ 17,793 $ 1,247 $ COMMITMENT INVESTMENT COMMITMENT REMAINING YEAR COMMITMENT RETURN |
|
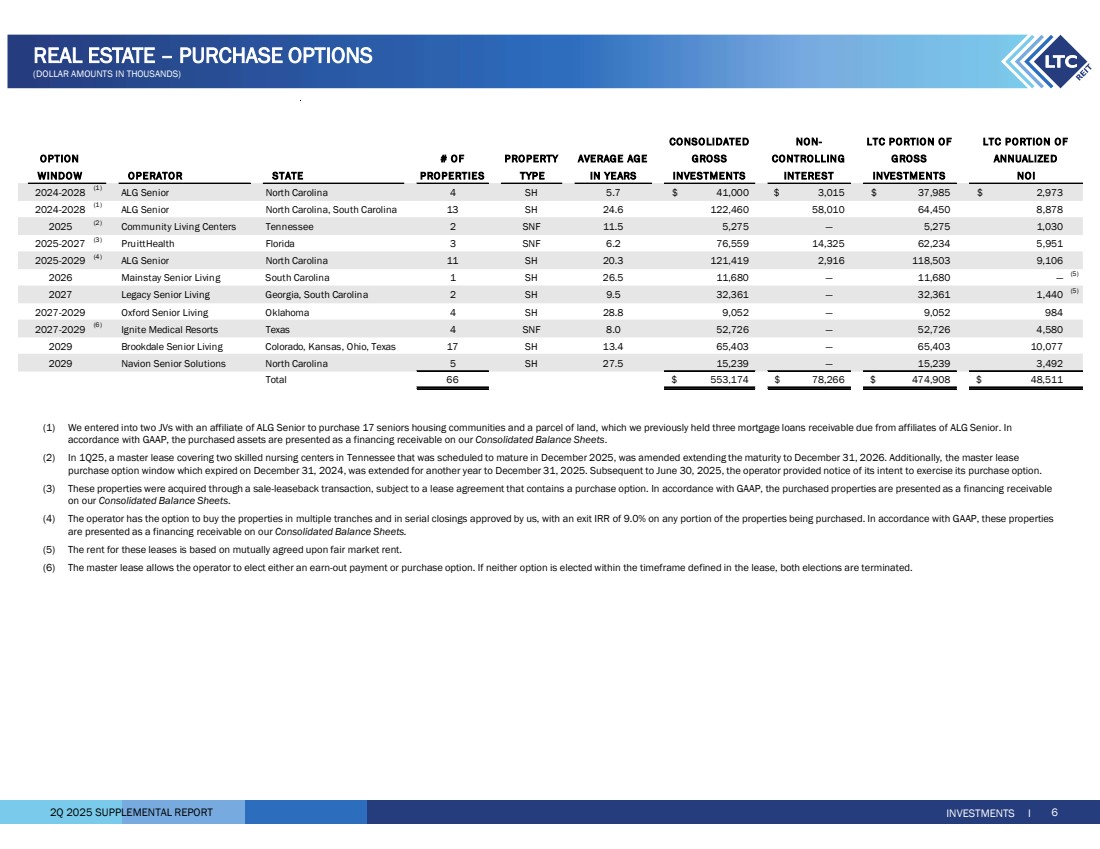
2Q 2025 SUPPLEMENTAL REPORT INVESTMENTS I 6 REAL ESTATE – PURCHASE OPTIONS (DOLLAR AMOUNTS IN THOUSANDS) CONSO LIDATED NON-OPTION # OF PRO PERTY AVERAGE AGE GROSS CONTROLLING GROSS WINDOW OPERATOR STATE PROPERTIES TYPE IN YEARS INVESTMENTS INTEREST INVESTMENTS 2024-2028 (1) ALG Senior North Carolina 4 SH 5.7 41,000 $ 3,015 $ 37,985 $ 2,973 $ 2024-2028 (1) ALG Senior North Carolina, South Carolina 13 SH 24.6 122,460 58,010 64,450 8,878 2025 (2) Community Living Centers Tennessee 2 SNF 11.5 5,275 — 5,275 1,030 2025-2027 (3) PruittHealth Florida 3 SNF 6.2 76,559 14,325 62,234 5,951 2025-2029 (4) ALG Senior North Carolina 11 SH 20.3 121,419 2,916 118,503 9,106 2026 Mainstay Senior Living South Carolina 1 SH 26.5 11,680 — 11,680 — (5) 2027 Legacy Senior Living Georgia, South Carolina 2 SH 9.5 32,361 — 32,361 1,440 (5) 2027-2029 Oxford Senior Living Oklahoma 4 SH 28.8 9,052 — 9,052 984 2027-2029 (6) Ignite Medical Resorts Texas 4 SNF 8.0 52,726 — 52,726 4,580 2029 Brookdale Senior Living Colorado, Kansas, Ohio, Texas 17 SH 13.4 65,403 — 65,403 10,077 2029 Navion Senior Solutions North Carolina 5 SH 27.5 15,239 — 15,239 3,492 Total 66 553,174 $ 78,266 $ 474,908 $ 48,511 $ CONTRACTUAL CASH ANNUALIZED NOI LTC PORTIO N OF LTC PORTION OF (1) We entered into two JVs with an affiliate of ALG Senior to purchase 17 seniors housing communities and a parcel of land, which we previously held three mortgage loans receivable due from affiliates of ALG Senior. In accordance with GAAP, the purchased assets are presented as a financing receivable on our Consolidated Balance Sheets. (2) In 1Q25, a master lease covering two skilled nursing centers in Tennessee that was scheduled to mature in December 2025, was amended extending the maturity to December 31, 2026. Additionally, the master lease purchase option window which expired on December 31, 2024, was extended for another year to December 31, 2025. Subsequent to June 30, 2025, the operator provided notice of its intent to exercise its purchase option. (3) These properties were acquired through a sale-leaseback transaction, subject to a lease agreement that contains a purchase option. In accordance with GAAP, the purchased properties are presented as a financing receivable on our Consolidated Balance Sheets. (4) The operator has the option to buy the properties in multiple tranches and in serial closings approved by us, with an exit IRR of 9.0% on any portion of the properties being purchased. In accordance with GAAP, these properties are presented as a financing receivable on our Consolidated Balance Sheets. (5) The rent for these leases is based on mutually agreed upon fair market rent. (6) The master lease allows the operator to elect either an earn-out payment or purchase option. If neither option is elected within the timeframe defined in the lease, both elections are terminated. |
|
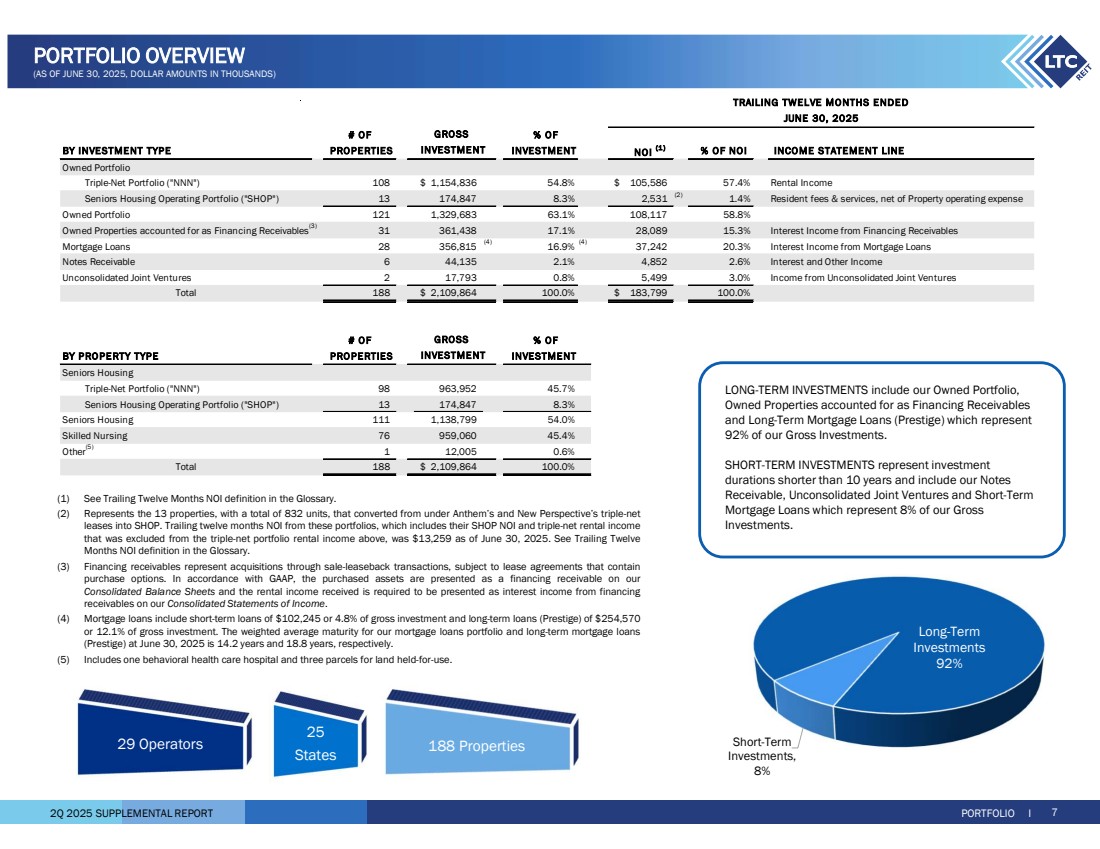
2Q 2025 SUPPLEMENTAL REPORT# OF % OF BY INVESTMENT TYPE PROPERTIES INVESTMENT NOI (1 ) % OF NOI INCOME STATEMENT LINE Owned Portfolio Triple-Net Portfolio ("NNN") 108 1,154,836 $ 54.8% 105,586 $ 57.4% Rental Income Seniors Housing Operating Portfolio ("SHOP") 13 174,847 8.3% 2,531 (2) 1.4% Resident fees & services, net of Property operating expense Owned Portfolio 121 1,329,683 63.1% 108,117 58.8% Owned Properties accounted for as Financing Receivables(3) 361,438 31 17.1% 28,089 15.3% Interest Income from Financing Receivables Mortgage Loans 28 356,815 (4) 16.9% (4) 20.3% Interest Income from Mortgage Loans 37,242 Notes Receivable 6 44,135 2.1% 4,852 2.6% Interest and Other Income Unconsolidated Joint Ventures 2 17,793 0.8% 5,499 3.0% Income from Unconsolidated Joint Ventures Total 188 2,109,864 $ 100.0% 183,799 $ 100.0% # OF % OF BY PROPERTY TYPE PROPERTIES INVESTMENT Seniors Housing Triple-Net Portfolio ("NNN") 98 963,952 45.7% Seniors Housing Operating Portfolio ("SHOP") 13 174,847 8.3% Seniors Housing 111 1,138,799 54.0% Skilled Nursing 76 959,060 45.4% Other(5) 12,005 1 0.6% Total 188 2,109,864 $ 100.0% INVESTMENT GROSS INVESTMENT TRAILING TWELVE MONTHS ENDED JUNE 30, 2025 GROSS PORTFOLIO I PORTFOLIO OVERVIEW (AS OF JUNE 30, 2025, DOLLAR AMOUNTS IN THOUSANDS) 29 Operators 25 States 188 Properties (1) See Trailing Twelve Months NOI definition in the Glossary. (2) Represents the 13 properties, with a total of 832 units, that converted from under Anthem’s and New Perspective’s triple-net leases into SHOP. Trailing twelve months NOI from these portfolios, which includes their SHOP NOI and triple-net rental income that was excluded from the triple-net portfolio rental income above, was $13,259 as of June 30, 2025. See Trailing Twelve Months NOI definition in the Glossary. (3) Financing receivables represent acquisitions through sale-leaseback transactions, subject to lease agreements that contain purchase options. In accordance with GAAP, the purchased assets are presented as a financing receivable on our Consolidated Balance Sheets and the rental income received is required to be presented as interest income from financing receivables on our Consolidated Statements of Income. (4) Mortgage loans include short-term loans of $102,245 or 4.8% of gross investment and long-term loans (Prestige) of $254,570 or 12.1% of gross investment. The weighted average maturity for our mortgage loans portfolio and long-term mortgage loans (Prestige) at June 30, 2025 is 14.2 years and 18.8 years, respectively. (5) Includes one behavioral health care hospital and three parcels for land held-for-use. 7 LONG-TERM INVESTMENTS include our Owned Portfolio, Owned Properties accounted for as Financing Receivables and Long-Term Mortgage Loans (Prestige) which represent 92% of our Gross Investments. SHORT-TERM INVESTMENTS represent investment durations shorter than 10 years and include our Notes Receivable, Unconsolidated Joint Ventures and Short-Term Mortgage Loans which represent 8% of our Gross Investments. Long-Term Investments 92% Short-Term Investments, 8% |
|
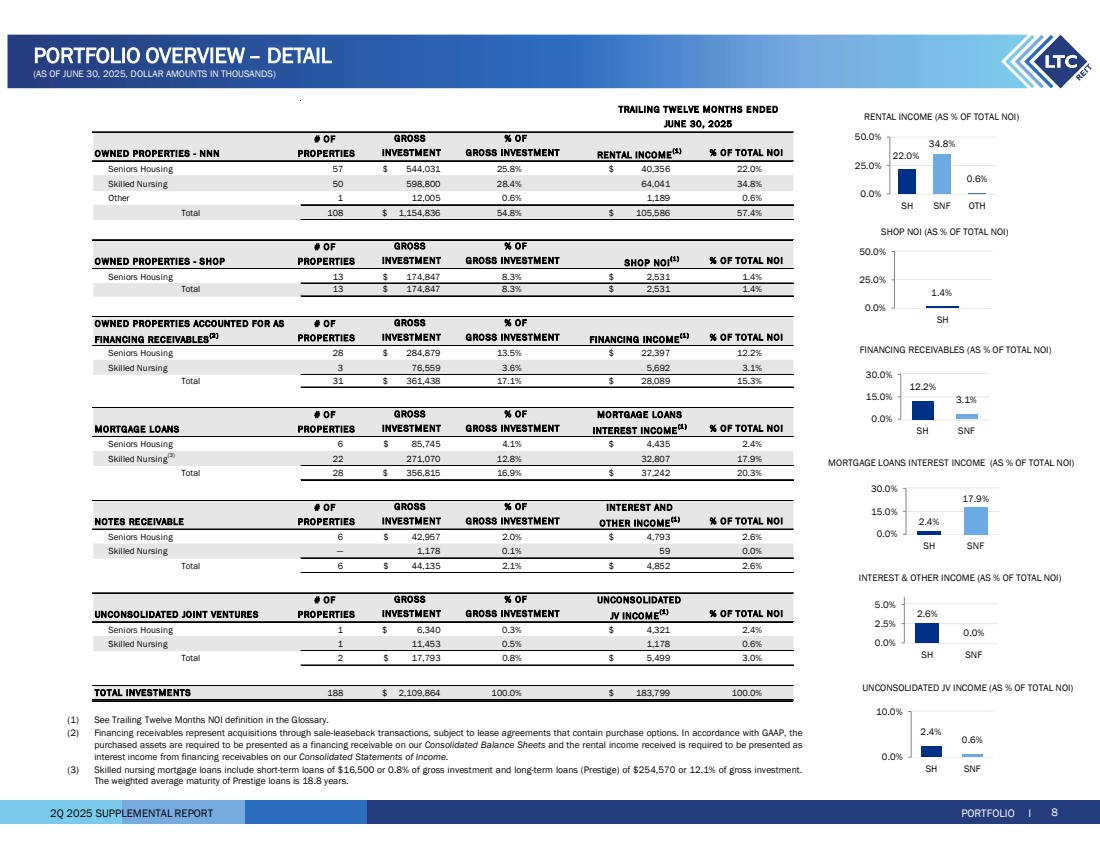
2Q 2025 SUPPLEMENTAL REPORT PORTFOLIO I 8 PORTFOLIO OVERVIEW – DETAIL (AS OF JUNE 30, 2025, DOLLAR AMOUNTS IN THOUSANDS) # OF OWNE D PROPERTIES - NNN PROPE RTIES RENTAL INCOME(1 ) Seniors Housing 57 544,031 $ 25.8% 40,356 $ 22.0% Skilled Nursing 50 598,800 28.4% 64,041 34.8% Other 1 12,005 0.6% 1,189 0.6% Total 108 1,154,836 $ 54.8% 105,586 $ 57.4% # OF OWNE D PROPERTIES - SHOP PROPE RTIES SHOP NOI(1 ) Seniors Housing 13 174,847 $ 8.3% 2,531 $ 1.4% Total 13 174,847 $ 8.3% 2,531 $ 1.4% OWNE D PROPERTIES ACCOUNTE D FOR AS # OF FINANCING RECEIVABLES(2 ) PROPERTIE S FINANCING INCOME(1 ) Seniors Housing 28 284,879 $ 13.5% 22,397 $ 12.2% Skilled Nursing 3 76,559 3.6% 5,692 3.1% Total 31 361,438 $ 17.1% 28,089 $ 15.3% # OF MORTGAGE LO ANS MORTGAGE LOANS PROPE RTIES INTEREST INCOME(1 ) Seniors Housing 6 85,745 $ 4.1% 4,435 $ 2.4% Skilled Nursing(3) 271,070 22 12.8% 32,807 17.9% Total 28 356,815 $ 16.9% 37,242 $ 20.3% # OF INTERE ST AND NOTES RE CEIVABLE PROPE RTIES OTHER INCOME(1 ) Seniors Housing 6 42,957 $ 2.0% 4,793 $ 2.6% Skilled Nursing — 1,178 0.1% 59 0.0% Total 6 44,135 $ 2.1% 4,852 $ 2.6% # OF UNCONSOLIDATED UNCONSOLIDATED JOINT VENTURE S PROPE RTIES JV INCOME(1 ) Seniors Housing 1 6,340 $ 0.3% 4,321 $ 2.4% Skilled Nursing 1 11,453 0.5% 1,178 0.6% Total 2 17,793 $ 0.8% 5,499 $ 3.0% TOTAL INVESTME NTS 2,109,864 188 $ 100.0% 183,799 $ 100.0% GROSS % OF INVE STME NT GRO SS INVESTME NT % OF TOTAL NOI GROSS % OF INVE STME NT GRO SS INVESTME NT % OF TOTAL NOI INVE STME NT GROSS GROSS INVE STME NT GRO SS INVESTMENT % OF GRO SS INVESTMENT % OF INVE STME NT TRAILING TWE LVE MONTHS E NDED JUNE 30, 2025 GROSS % OF GRO SS INVESTMENT % OF TOTAL NOI GRO SS INVESTMENT % OF GROSS INVE STME NT % OF TOTAL NOI % OF TOTAL NOI % OF TOTAL NOI 22.0% 34.8% 0.6% 0.0% 25.0% 50.0% SH SNF OTH RENTAL INCOME (AS % OF TOTAL NOI) MORTGAGE LOANS INTEREST INCOME (AS % OF TOTAL NOI) INTEREST & OTHER INCOME (AS % OF TOTAL NOI) UNCONSOLIDATED JV INCOME (AS % OF TOTAL NOI) 2.4% 17.9% 0.0% 15.0% 30.0% SH SNF 2.6% 0.0% 0.0% 2.5% 5.0% SH SNF 2.4% 0.6% 0.0% 10.0% SH SNF 12.2% 3.1% 0.0% 15.0% 30.0% SH SNF FINANCING RECEIVABLES (AS % OF TOTAL NOI) (1) See Trailing Twelve Months NOI definition in the Glossary. (2) Financing receivables represent acquisitions through sale-leaseback transactions, subject to lease agreements that contain purchase options. In accordance with GAAP, the purchased assets are required to be presented as a financing receivable on our Consolidated Balance Sheets and the rental income received is required to be presented as interest income from financing receivables on our Consolidated Statements of Income. (3) Skilled nursing mortgage loans include short-term loans of $16,500 or 0.8% of gross investment and long-term loans (Prestige) of $254,570 or 12.1% of gross investment. The weighted average maturity of Prestige loans is 18.8 years. 1.4% 0.0% 25.0% 50.0% SH SHOP NOI (AS % OF TOTAL NOI) |
|
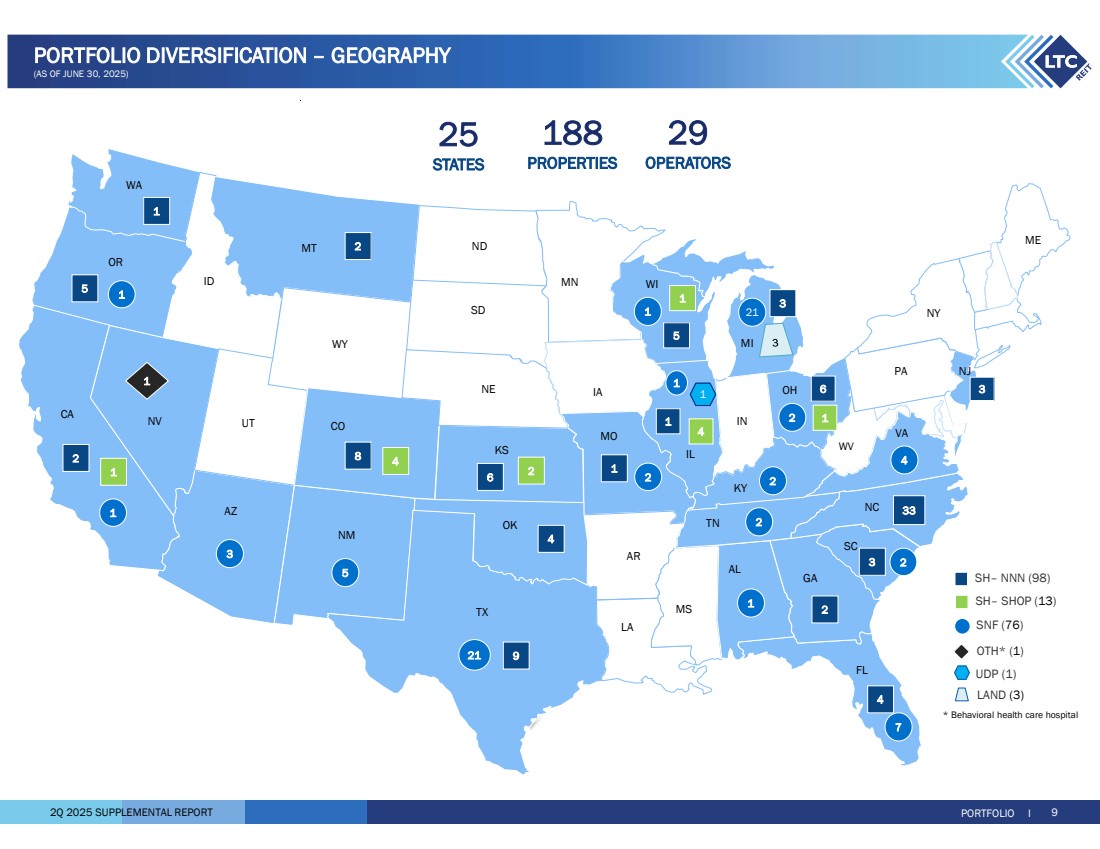
2Q 2025 SUPPLEMENTAL REPORT PORTFOLIO I 9 PORTFOLIO DIVERSIFICATION – GEOGRAPHY (AS OF JUNE 30, 2025) * Behavioral health care hospital SNF (76) SH– NNN (98) OTH* (1) LAND (3) UDP (1) CA WA ME NV WY IL AR WV ND NY OR AZ NM TX UT ID MT SD NE KS OK MS MN WI FL AL GA SC TN MO IA IN OH PA NJ NC VA CO KY 7 21 1 1 3 1 2 4 2 1 2 4 9 33 4 6 6 8 5 3 21 2 1 5 1 1 2 5 LA 2 2 3 MI 2 1 1 1 3 SH– SHOP (13) 4 1 2 4 1 1 25 STATES 188 PROPERTIES 29 OPERATORS |
|
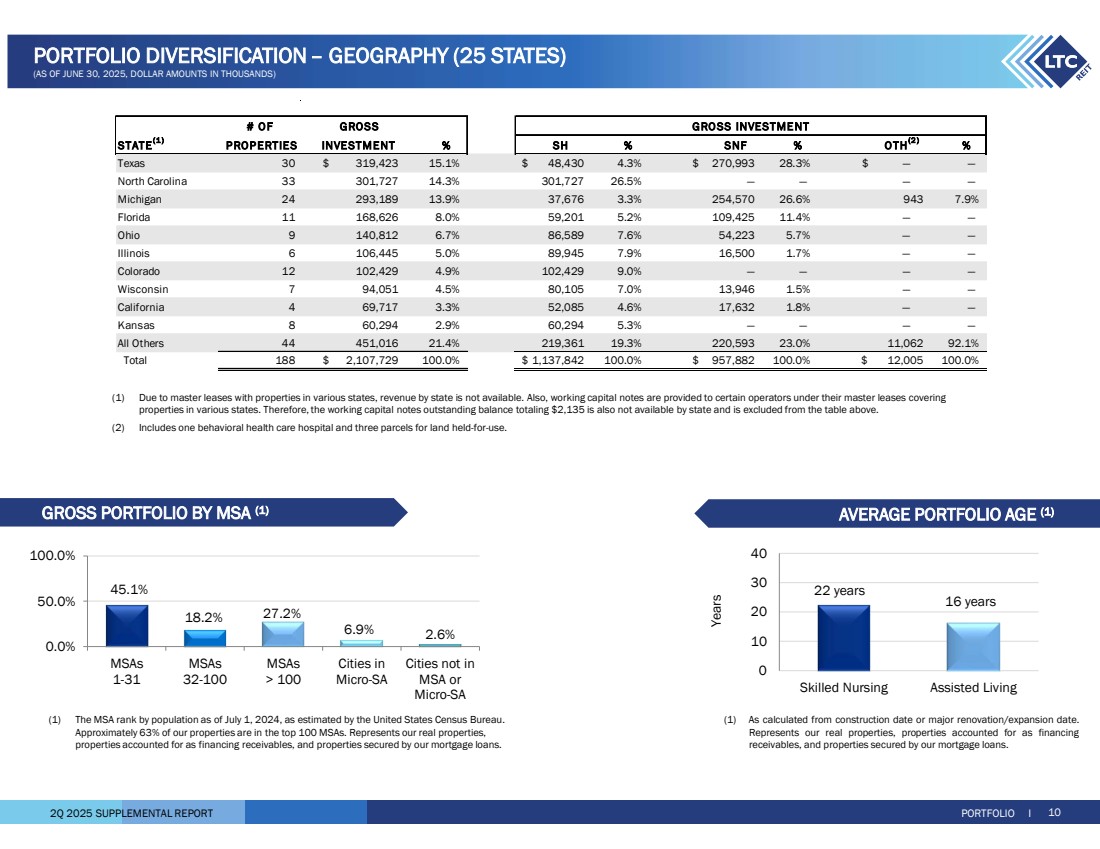
2Q 2025 SUPPLEMENTAL REPORT 45.1% 18.2% 27.2% 6.9% 2.6% 0.0% 50.0% 100.0% MSAs 1-31 MSAs 32-100 MSAs > 100 Cities in Micro-SA Cities not in MSA or Micro-SA 22 years 16 years 0 10 20 30 40 Skilled Nursing Assisted Living Years (1) The MSA rank by population as of July 1, 2024, as estimated by the United States Census Bureau. Approximately 63% of our properties are in the top 100 MSAs. Represents our real properties, properties accounted for as financing receivables, and properties secured by our mortgage loans. (1) As calculated from construction date or major renovation/expansion date. Represents our real properties, properties accounted for as financing receivables, and properties secured by our mortgage loans. GROSS PORTFOLIO BY MSA (1) AVERAGE PORTFOLIO AGE (1) PORTFOLIO I 10 PORTFOLIO DIVERSIFICATION – GEOGRAPHY (25 STATES) (AS OF JUNE 30, 2025, DOLLAR AMOUNTS IN THOUSANDS) # OF STATE(1 ) PROPERTIES % SH % SNF % % Texas 30 319,423 $ 15.1% 48,430 $ 4.3% 270,993 $ 28.3% — $ — North Carolina 33 301,727 14.3% 301,727 26.5% — — — — Michigan 24 293,189 13.9% 37,676 3.3% 254,570 26.6% 943 7.9% Florida 11 168,626 8.0% 59,201 5.2% 109,425 11.4% — — Ohio 9 140,812 6.7% 86,589 7.6% 54,223 5.7% — — Illinois 6 106,445 5.0% 89,945 7.9% 16,500 1.7% — — Colorado 12 102,429 4.9% 102,429 9.0% — — — — Wisconsin 7 94,051 4.5% 80,105 7.0% 13,946 1.5% — — California 4 69,717 3.3% 52,085 4.6% 17,632 1.8% — — Kansas 8 60,294 2.9% 60,294 5.3% — — — — All Others 44 451,016 21.4% 219,361 19.3% 220,593 23.0% 11,062 92.1% Total 188 2,107,729 $ 100.0% 1,137,842 $ 100.0% 957,882 $ 100.0% 12,005 $ 100.0% OTH(2 ) INVESTMENT GROSS GRO SS INVESTME NT (1) Due to master leases with properties in various states, revenue by state is not available. Also, working capital notes are provided to certain operators under their master leases covering properties in various states. Therefore, the working capital notes outstanding balance totaling $2,135 is also not available by state and is excluded from the table above. (2) Includes one behavioral health care hospital and three parcels for land held-for-use. |
|
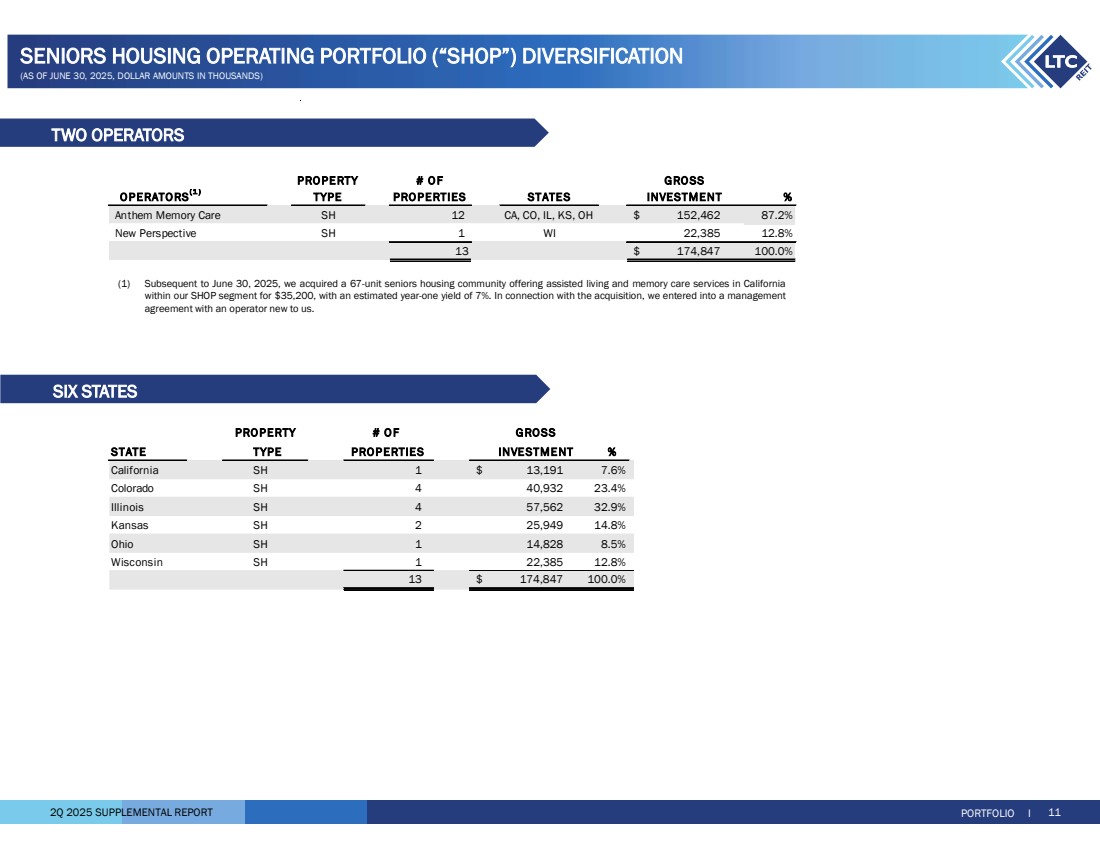
2Q 2025 SUPPLEMENTAL REPORT PORTFOLIO I 11 SENIORS HOUSING OPERATING PORTFOLIO (“SHOP”) DIVERSIFICATION (AS OF JUNE 30, 2025, DOLLAR AMOUNTS IN THOUSANDS) PROPERTY # O F GRO SS OPERATORS(1 ) TYPE PROPERTIES STATES INVESTMENT % Anthem Memory Care SH 12 CA, CO, IL, KS, OH 152,462 $ 87.2% New Perspective SH 1 WI 22,385 12.8% 13 174,847 $ 100.0% (1) Subsequent to June 30, 2025, we acquired a 67-unit seniors housing community offering assisted living and memory care services in California within our SHOP segment for $35,200, with an estimated year-one yield of 7%. In connection with the acquisition, we entered into a management agreement with an operator new to us. TWO OPERATORS SIX STATES PROPERTY # O F STATE TYPE PROPERTIES % California SH 1 13,191 $ 7.6% Colorado SH 4 40,932 23.4% Illinois SH 4 57,562 32.9% Kansas SH 2 25,949 14.8% Ohio SH 1 14,828 8.5% Wisconsin SH 1 22,385 12.8% 174,847 13 $ 100.0% INVE STMENT GROSS |
|
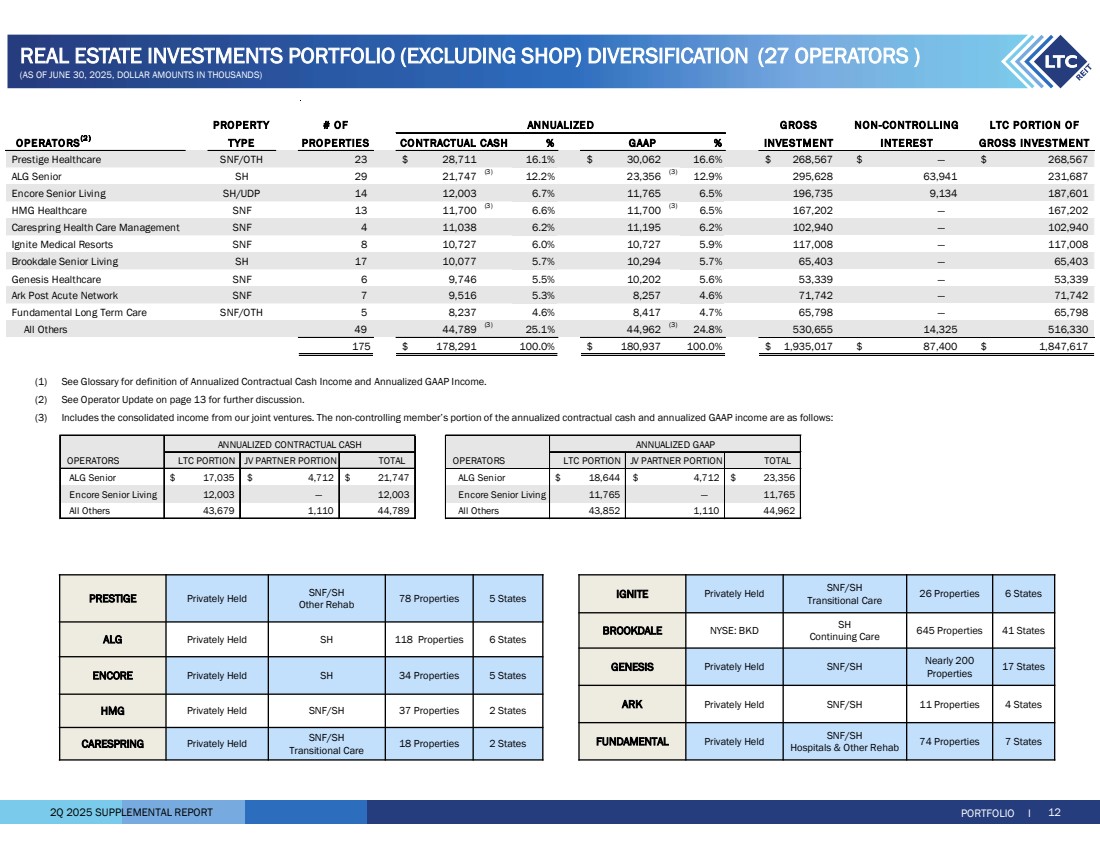
2Q 2025 SUPPLEMENTAL REPORT PORTFOLIO I 12 REAL ESTATE INVESTMENTS PORTFOLIO (EXCLUDING SHOP) DIVERSIFICATION (27 OPERATORS ) (AS OF JUNE 30, 2025, DOLLAR AMOUNTS IN THOUSANDS) 26 Properties 6 States SNF/SH Transitional Care IGNITE Privately Held 645 Properties 41 States SH Continuing Care BROOKDALE NYSE: BKD 17 States Nearly 200 Properties GENESIS Privately Held SNF/SH ARK Privately Held SNF/SH 11 Properties 4 States 74 Properties 7 States SNF/SH Hospitals & Other Rehab FUNDAMENTAL Privately Held 78 Properties 5 States SNF/SH Other Rehab PRESTIGE Privately Held ALG Privately Held SH 118 Properties 6 States ENCORE Privately Held SH 34 Properties 5 States HMG Privately Held SNF/SH 37 Properties 2 States 18 Properties 2 States SNF/SH Transitional Care CARESPRING Privately Held (1) See Glossary for definition of Annualized Contractual Cash Income and Annualized GAAP Income. (2) See Operator Update on page 13 for further discussion. (3) Includes the consolidated income from our joint ventures. The non-controlling member’s portion of the annualized contractual cash and annualized GAAP income are as follows: OPERATORS LTC PORTION JV PARTNER PORTION TOTAL OPERATORS LTC PORTION JV PARTNER PORTION TOTAL ALG Senior 17,035 $ 4,712 $ 21,747 $ ALG Senior 18,644 $ 4,712 $ 23,356 $ Encore Senior Living 12,003 — 12,003 Encore Senior Living 11,765 — 11,765 All Others 43,679 1,110 44,789 All Others 43,852 1,110 44,962 ANNUALIZED CONTRACTUAL CASH ANNUALIZED GAAP PROPERTY # OF GROSS NON-CONTRO LLING LTC PORTIO N OF OPERATO RS(2 ) TYPE PRO PERTIES % GAAP % INVESTMENT INTEREST GROSS INVESTMENT Prestige Healthcare SNF/OTH 23 28,711 $ 16.1% 30,062 $ 16.6% 268,567 $ — $ 268,567 $ ALG Senior SH 29 21,747 (3) 12.2% 23,356 (3) 12.9% 295,628 63,941 231,687 Encore Senior Living SH/UDP 14 12,003 6.7% 11,765 6.5% 196,735 9,134 187,601 HMG Healthcare SNF 13 11,700 (3) 6.6% 11,700 (3) 6.5% 167,202 — 167,202 Carespring Health Care Management SNF 4 11,038 6.2% 11,195 6.2% 102,940 — 102,940 Ignite Medical Resorts SNF 8 10,727 6.0% 10,727 5.9% 117,008 — 117,008 Brookdale Senior Living SH 17 10,077 5.7% 10,294 5.7% 65,403 — 65,403 Genesis Healthcare SNF 6 9,746 5.5% 10,202 5.6% 53,339 — 53,339 Ark Post Acute Network SNF 7 9,516 5.3% 8,257 4.6% 71,742 — 71,742 Fundamental Long Term Care SNF/OTH 5 8,237 4.6% 8,417 4.7% 65,798 — 65,798 All Others 49 44,789 (3) 25.1% 44,962 (3) 24.8% 530,655 14,325 516,330 175 178,291 $ 100.0% 180,937 $ 100.0% 1,935,017 $ 87,400 $ 1,847,617 $ CO NTRACTUAL CASH ANNUALIZED |
|
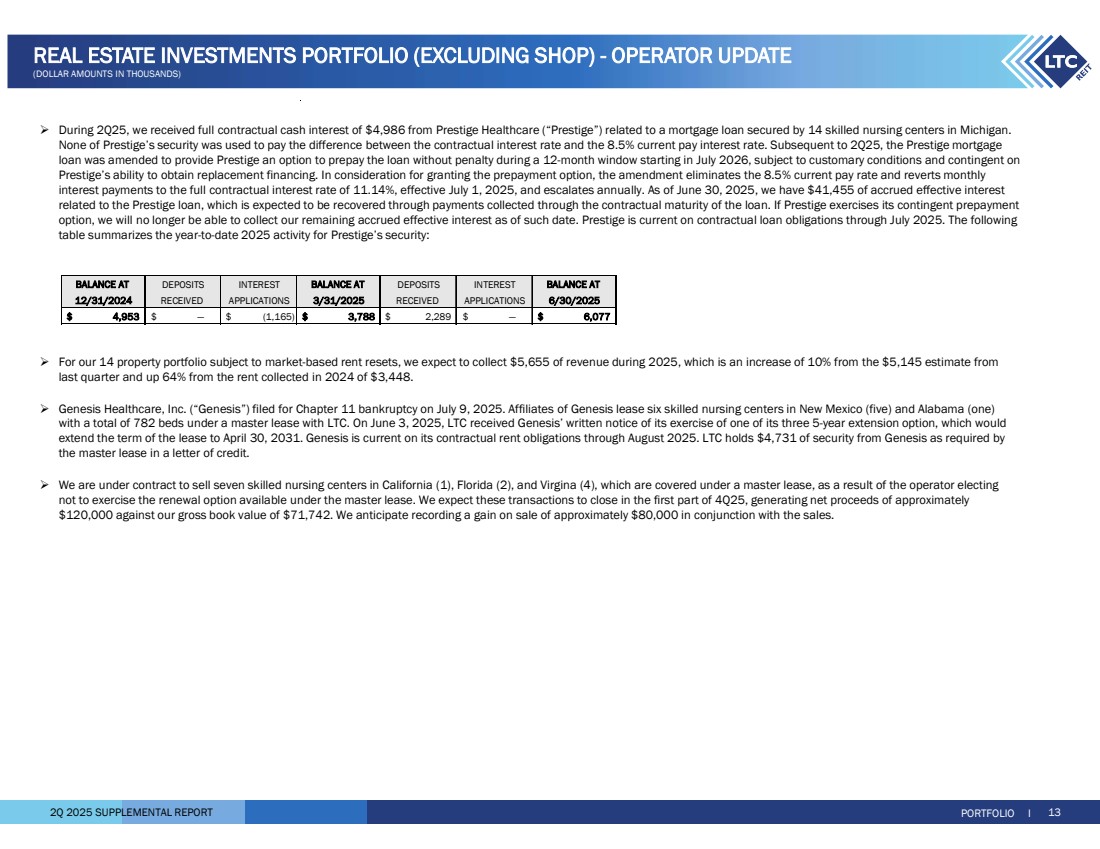
2Q 2025 SUPPLEMENTAL REPORT PORTFOLIO I 13 REAL ESTATE INVESTMENTS PORTFOLIO (EXCLUDING SHOP) - OPERATOR UPDATE (DOLLAR AMOUNTS IN THOUSANDS) During 2Q25, we received full contractual cash interest of $4,986 from Prestige Healthcare (“Prestige”) related to a mortgage loan secured by 14 skilled nursing centers in Michigan. None of Prestige’s security was used to pay the difference between the contractual interest rate and the 8.5% current pay interest rate. Subsequent to 2Q25, the Prestige mortgage loan was amended to provide Prestige an option to prepay the loan without penalty during a 12-month window starting in July 2026, subject to customary conditions and contingent on Prestige’s ability to obtain replacement financing. In consideration for granting the prepayment option, the amendment eliminates the 8.5% current pay rate and reverts monthly interest payments to the full contractual interest rate of 11.14%, effective July 1, 2025, and escalates annually. As of June 30, 2025, we have $41,455 of accrued effective interest related to the Prestige loan, which is expected to be recovered through payments collected through the contractual maturity of the loan. If Prestige exercises its contingent prepayment option, we will no longer be able to collect our remaining accrued effective interest as of such date. Prestige is current on contractual loan obligations through July 2025. The following table summarizes the year-to-date 2025 activity for Prestige’s security: For our 14 property portfolio subject to market-based rent resets, we expect to collect $5,655 of revenue during 2025, which is an increase of 10% from the $5,145 estimate from last quarter and up 64% from the rent collected in 2024 of $3,448. Genesis Healthcare, Inc. (“Genesis”) filed for Chapter 11 bankruptcy on July 9, 2025. Affiliates of Genesis lease six skilled nursing centers in New Mexico (five) and Alabama (one) with a total of 782 beds under a master lease with LTC. On June 3, 2025, LTC received Genesis’ written notice of its exercise of one of its three 5-year extension option, which would extend the term of the lease to April 30, 2031. Genesis is current on its contractual rent obligations through August 2025. LTC holds $4,731 of security from Genesis as required by the master lease in a letter of credit. We are under contract to sell seven skilled nursing centers in California (1), Florida (2), and Virgina (4), which are covered under a master lease, as a result of the operator electing not to exercise the renewal option available under the master lease. We expect these transactions to close in the first part of 4Q25, generating net proceeds of approximately $120,000 against our gross book value of $71,742. We anticipate recording a gain on sale of approximately $80,000 in conjunction with the sales. BALANCE AT DEPOSITS INTEREST BALANCE AT DEPOSITS INTEREST BALANCE AT 12/31/2024 RECEIVED APPLICATIONS 3/31/2025 RECEIVED APPLICATIONS 6/30/2025 $ 4,953 $ (1,165) — $ $ 3,788 $ — 2,289 $ $ 6,077 |
|
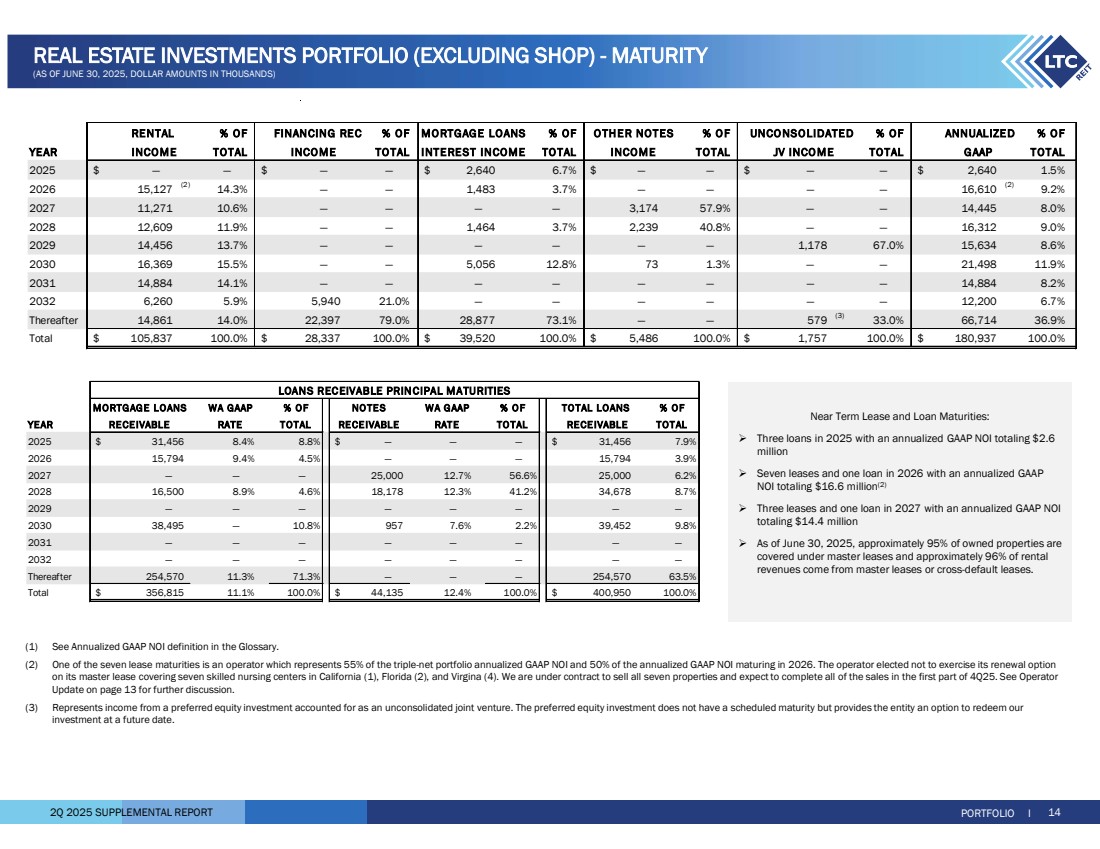
2Q 2025 SUPPLEMENTAL REPORT REAL ESTATE INVESTMENTS PORTFOLIO (EXCLUDING SHOP) - MATURITY (AS OF JUNE 30, 2025, DOLLAR AMOUNTS IN THOUSANDS) % OF % OF % OF % O F % OF % O F YEAR TOTAL TO TAL TO TAL TOTAL TOTAL TOTAL 2025 — $ — — $ — 2,640 $ 6.7% — $ — — $ — 2,640 $ 1.5% 2026 15,127 (2) 14.3% — — 1,483 3.7% — — — — 16,610 (2) 9.2% 2027 11,271 10.6% — — — — 3,174 57.9% — — 14,445 8.0% 2028 12,609 11.9% — — 1,464 3.7% 2,239 40.8% — — 16,312 9.0% 2029 14,456 13.7% — — — — — — 1,178 67.0% 15,634 8.6% 2030 16,369 15.5% — — 5,056 12.8% 73 1.3% — — 21,498 11.9% 2031 14,884 14.1% — — — — — — — — 14,884 8.2% 2032 6,260 5.9% 5,940 21.0% — — — — — — 12,200 6.7% Thereafter 14,861 14.0% 22,397 79.0% 28,877 73.1% — — 579 (3) 33.0% 66,714 36.9% Total 105,837 $ 100.0% 28,337 $ 100.0% 39,520 $ 100.0% 5,486 $ 100.0% 1,757 $ 100.0% 180,937 $ 100.0% RENTAL UNCO NSOLIDATED INCOME FINANCING REC O THER NOTES INCOME INTEREST INCOME MORTGAGE LOANS INCOME JV INCO ME GAAP ANNUALIZED PORTFOLIO I 14 (1) See Annualized GAAP NOI definition in the Glossary. (2) One of the seven lease maturities is an operator which represents 55% of the triple-net portfolio annualized GAAP NOI and 50% of the annualized GAAP NOI maturing in 2026. The operator elected not to exercise its renewal option on its master lease covering seven skilled nursing centers in California (1), Florida (2), and Virgina (4). We are under contract to sell all seven properties and expect to complete all of the sales in the first part of 4Q25. See Operator Update on page 13 for further discussion. (3) Represents income from a preferred equity investment accounted for as an unconsolidated joint venture. The preferred equity investment does not have a scheduled maturity but provides the entity an option to redeem our investment at a future date. MORTGAGE LOANS WA GAAP % OF NO TE S WA GAAP % O F % OF YEAR RECEIVABLE RATE TOTAL RECEIVABLE RATE TO TAL TOTAL 2025 31,456 $ 8.4% 8.8% — $ — — 31,456 $ 7.9% 2026 15,794 9.4% 4.5% — — — 15,794 3.9% 2027 — — — 25,000 12.7% 56.6% 25,000 6.2% 2028 16,500 8.9% 4.6% 18,178 12.3% 41.2% 34,678 8.7% 2029 — — — — — — — — 2030 38,495 — 10.8% 957 7.6% 2.2% 39,452 9.8% 2031 — — — — — — — — 2032 — — — — — — — — Thereafter 254,570 11.3% 71.3% — — — 254,570 63.5% Total 356,815 $ 11.1% 100.0% 44,135 $ 12.4% 100.0% 400,950 $ 100.0% RECE IVABLE TOTAL LOANS LOANS RECEIVABLE PRINCIPAL MATURITIES Near Term Lease and Loan Maturities: Three loans in 2025 with an annualized GAAP NOI totaling $2.6 million Seven leases and one loan in 2026 with an annualized GAAP NOI totaling $16.6 million(2) Three leases and one loan in 2027 with an annualized GAAP NOI totaling $14.4 million As of June 30, 2025, approximately 95% of owned properties are covered under master leases and approximately 96% of rental revenues come from master leases or cross-default leases. |
|
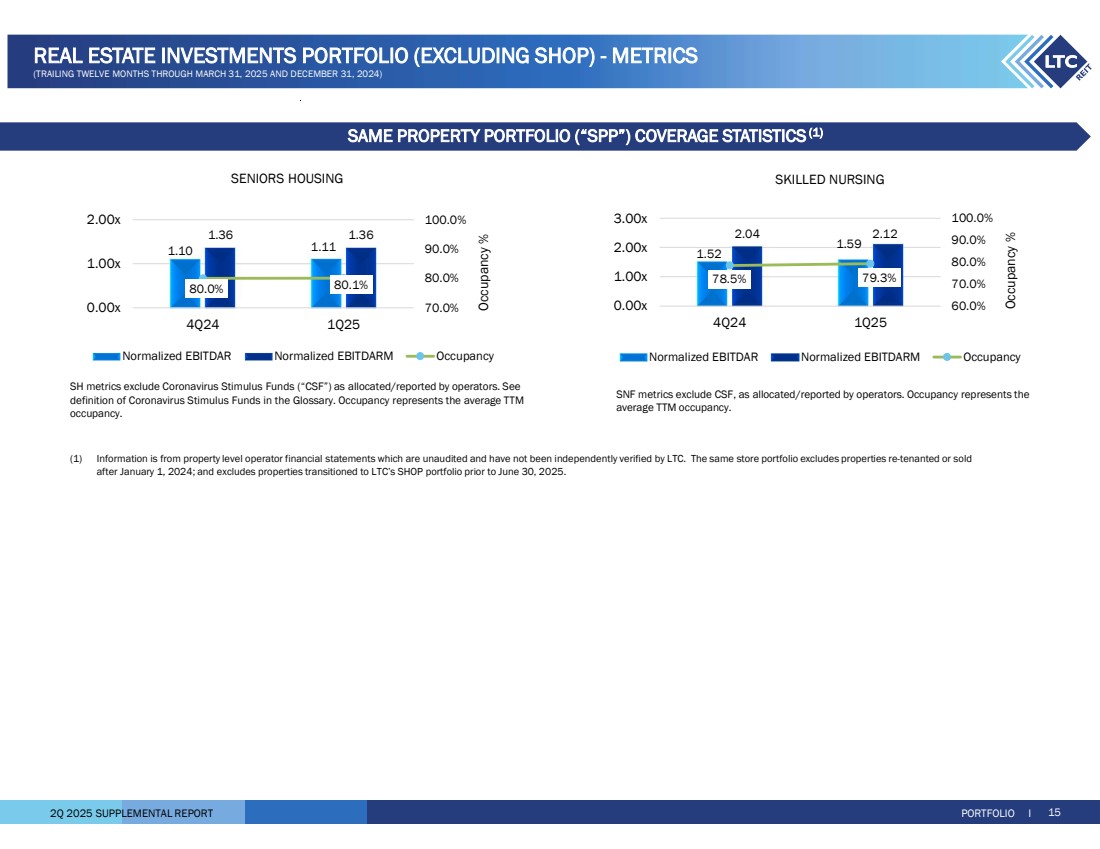
2Q 2025 SUPPLEMENTAL REPORT (1) Information is from property level operator financial statements which are unaudited and have not been independently verified by LTC. The same store portfolio excludes properties re-tenanted or sold after January 1, 2024; and excludes properties transitioned to LTC’s SHOP portfolio prior to June 30, 2025. SENIORS HOUSING SKILLED NURSING 1.52 1.59 2.04 2.12 78.5% 79.3% 60.0% 70.0% 80.0% 90.0% 100.0% 0.00x 1.00x 2.00x 3.00x 4Q24 1Q25 Occupancy % Normalized EBITDAR Normalized EBITDARM Occupancy 1.10 1.11 1.36 1.36 80.0% 80.1% 70.0% 80.0% 90.0% 100.0% 0.00x 1.00x 2.00x 4Q24 1Q25 Occupancy % Normalized EBITDAR Normalized EBITDARM Occupancy SNF metrics exclude CSF, as allocated/reported by operators. Occupancy represents the average TTM occupancy. SH metrics exclude Coronavirus Stimulus Funds (“CSF”) as allocated/reported by operators. See definition of Coronavirus Stimulus Funds in the Glossary. Occupancy represents the average TTM occupancy. PORTFOLIO I 15 REAL ESTATE INVESTMENTS PORTFOLIO (EXCLUDING SHOP) - METRICS (TRAILING TWELVE MONTHS THROUGH MARCH 31, 2025 AND DECEMBER 31, 2024) SAME PROPERTY PORTFOLIO (“SPP”) COVERAGE STATISTICS(1) |
|
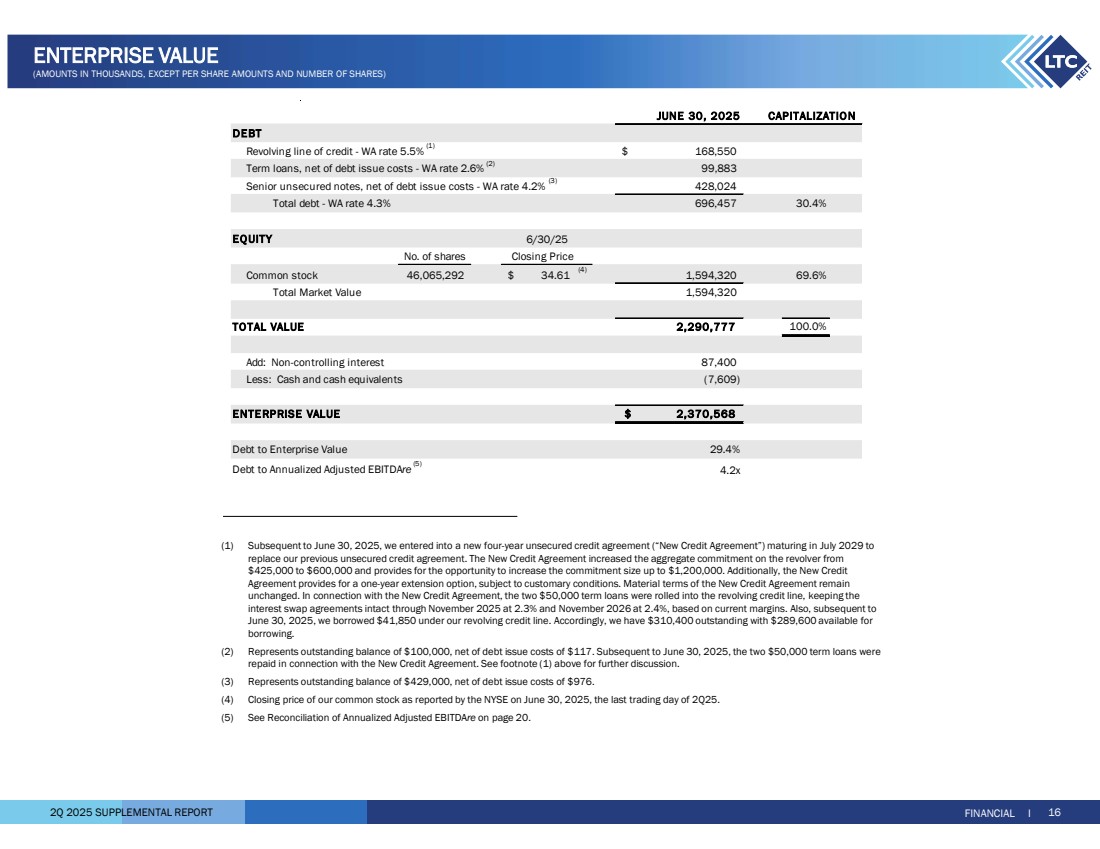
2Q 2025 SUPPLEMENTAL REPORT JUNE 30, 2025 Revolving line of credit - WA rate 5.5% (1) $ 168,550 Term loans, net of debt issue costs - WA rate 2.6% (2) 99,883 Senior unsecured notes, net of debt issue costs - WA rate 4.2% (3) 428,024 Total debt - WA rate 4.3% 696,457 30.4% No. of shares Closing Price Common stock 46,065,292 34.61 $ (4) 69.6% 1,594,320 Total Market Value 1,594,320 2,290,777 100.0% Add: Non-controlling interest 87,400 Less: Cash and cash equivalents (7,609) $ 2,370,568 Debt to Enterprise Value 29.4% Debt to Annualized Adjusted EBITDAre (5) 4.2x TOTAL VALUE ENTE RPRISE VALUE 6/30/25 CAPITALIZATION DEBT EQUITY FINANCIAL I 16 ENTERPRISE VALUE (AMOUNTS IN THOUSANDS, EXCEPT PER SHARE AMOUNTS AND NUMBER OF SHARES) (1) Subsequent to June 30, 2025, we entered into a new four-year unsecured credit agreement (“New Credit Agreement”) maturing in July 2029 to replace our previous unsecured credit agreement. The New Credit Agreement increased the aggregate commitment on the revolver from $425,000 to $600,000 and provides for the opportunity to increase the commitment size up to $1,200,000. Additionally, the New Credit Agreement provides for a one-year extension option, subject to customary conditions. Material terms of the New Credit Agreement remain unchanged. In connection with the New Credit Agreement, the two $50,000 term loans were rolled into the revolving credit line, keeping the interest swap agreements intact through November 2025 at 2.3% and November 2026 at 2.4%, based on current margins. Also, subsequent to June 30, 2025, we borrowed $41,850 under our revolving credit line. Accordingly, we have $310,400 outstanding with $289,600 available for borrowing. (2) Represents outstanding balance of $100,000, net of debt issue costs of $117. Subsequent to June 30, 2025, the two $50,000 term loans were repaid in connection with the New Credit Agreement. See footnote (1) above for further discussion. (3) Represents outstanding balance of $429,000, net of debt issue costs of $976. (4) Closing price of our common stock as reported by the NYSE on June 30, 2025, the last trading day of 2Q25. (5) See Reconciliation of Annualized Adjusted EBITDAre on page 20. |
|
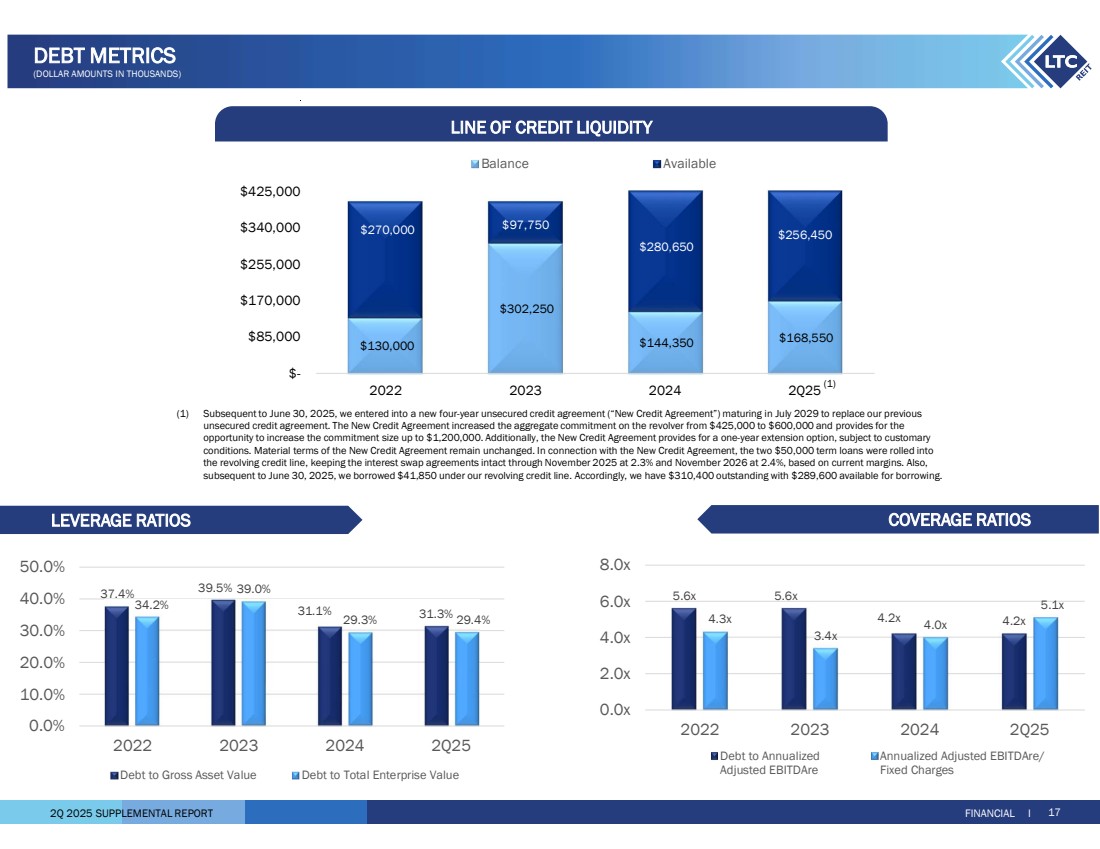
2Q 2025 SUPPLEMENTAL REPORT LEVERAGE RATIOS COVERAGE RATIOS LINE OF CREDIT LIQUIDITY FINANCIAL I 17 DEBT METRICS (DOLLAR AMOUNTS IN THOUSANDS) $130,000 $302,250 $144,350 $168,550 $270,000 $97,750 $280,650 $256,450 $- $85,000 $170,000 $255,000 $340,000 $425,000 2022 2023 2024 2Q25 Balance Available (1) Subsequent to June 30, 2025, we entered into a new four-year unsecured credit agreement (“New Credit Agreement”) maturing in July 2029 to replace our previous unsecured credit agreement. The New Credit Agreement increased the aggregate commitment on the revolver from $425,000 to $600,000 and provides for the opportunity to increase the commitment size up to $1,200,000. Additionally, the New Credit Agreement provides for a one-year extension option, subject to customary conditions. Material terms of the New Credit Agreement remain unchanged. In connection with the New Credit Agreement, the two $50,000 term loans were rolled into the revolving credit line, keeping the interest swap agreements intact through November 2025 at 2.3% and November 2026 at 2.4%, based on current margins. Also, subsequent to June 30, 2025, we borrowed $41,850 under our revolving credit line. Accordingly, we have $310,400 outstanding with $289,600 available for borrowing. (1) 37.4% 39.5% 31.1% 31.3% 34.2% 39.0% 29.3% 29.4% 0.0% 10.0% 20.0% 30.0% 40.0% 50.0% 2022 2023 2024 2Q25 Debt to Gross Asset Value Debt to Total Enterprise Value 5.6x 5.6x 4.3x 4.2x 4.2x 3.4x 4.0x 5.1x 0.0x 2.0x 4.0x 6.0x 8.0x 2022 2023 2024 2Q25 Debt to Annualized Adjusted EBITDAre Annualized Adjusted EBITDAre/ Fixed Charges |
|
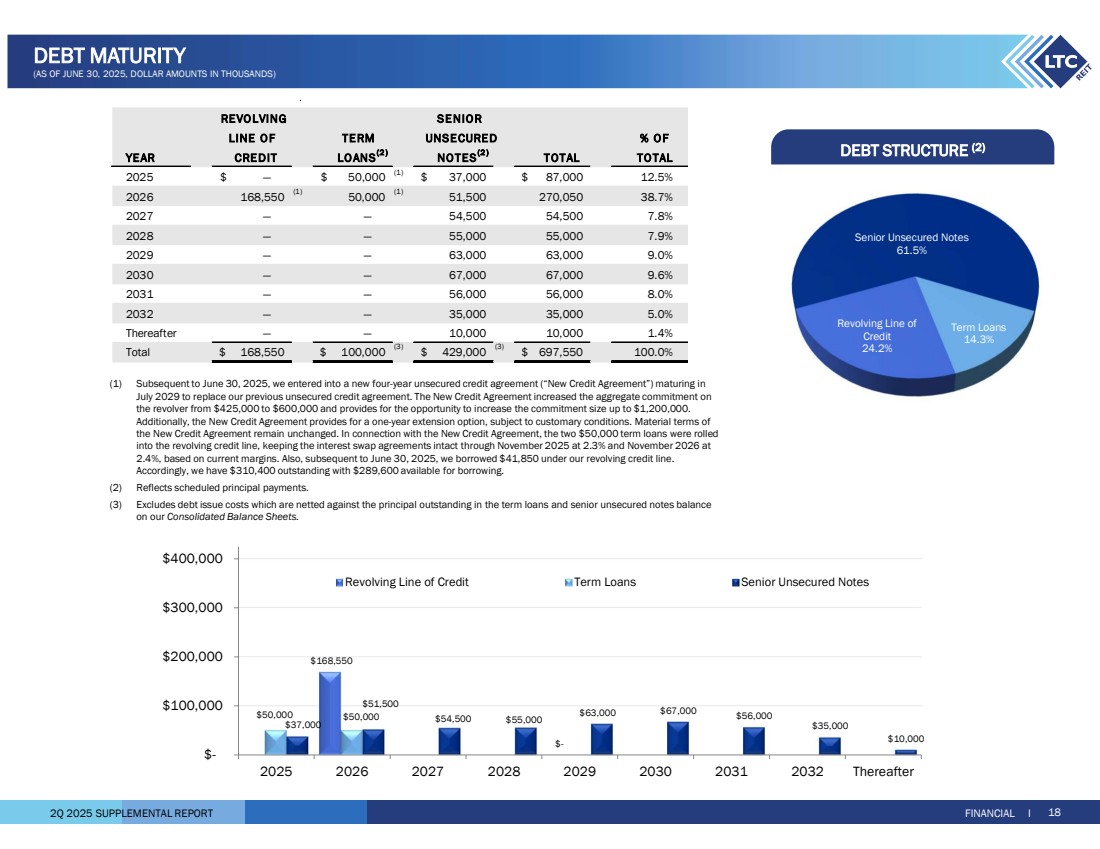
2Q 2025 SUPPLEMENTAL REPORT REVOLVING SENIOR LINE OF TERM UNSECURED % OF YEAR CREDIT LO ANS(2 ) NOTES(2 ) TOTAL TOTAL 2025 — $ 50,000 $ (1) $ 87,000 37,000 $ 12.5% 2026 168,550 (1) 50,000 (1) 270,050 51,500 38.7% 2027 — — 54,500 54,500 7.8% 2028 — — 55,000 55,000 7.9% 2029 — — 63,000 63,000 9.0% 2030 — — 67,000 67,000 9.6% 2031 — — 56,000 56,000 8.0% 2032 — — 35,000 35,000 5.0% Thereafter — — 10,000 10,000 1.4% Total 168,550 $ 100,000 $ (3) $ 429,000 (3) $ 100.0% 697,550 $168,550 $- $50,000 $50,000 $37,000 $51,500 $54,500 $55,000 $63,000 $67,000 $56,000 $35,000 $10,000 $- $100,000 $200,000 $300,000 $400,000 2025 2026 2027 2028 2029 2030 2031 2032 Thereafter Revolving Line of Credit Term Loans Senior Unsecured Notes Senior Unsecured Notes 61.5% Term Loans 14.3% Revolving Line of Credit 24.2% DEBT STRUCTURE (2) FINANCIAL I 18 DEBT MATURITY (AS OF JUNE 30, 2025, DOLLAR AMOUNTS IN THOUSANDS) (1) Subsequent to June 30, 2025, we entered into a new four-year unsecured credit agreement (“New Credit Agreement”) maturing in July 2029 to replace our previous unsecured credit agreement. The New Credit Agreement increased the aggregate commitment on the revolver from $425,000 to $600,000 and provides for the opportunity to increase the commitment size up to $1,200,000. Additionally, the New Credit Agreement provides for a one-year extension option, subject to customary conditions. Material terms of the New Credit Agreement remain unchanged. In connection with the New Credit Agreement, the two $50,000 term loans were rolled into the revolving credit line, keeping the interest swap agreements intact through November 2025 at 2.3% and November 2026 at 2.4%, based on current margins. Also, subsequent to June 30, 2025, we borrowed $41,850 under our revolving credit line. Accordingly, we have $310,400 outstanding with $289,600 available for borrowing. (2) Reflects scheduled principal payments. (3) Excludes debt issue costs which are netted against the principal outstanding in the term loans and senior unsecured notes balance on our Consolidated Balance Sheets. |
|
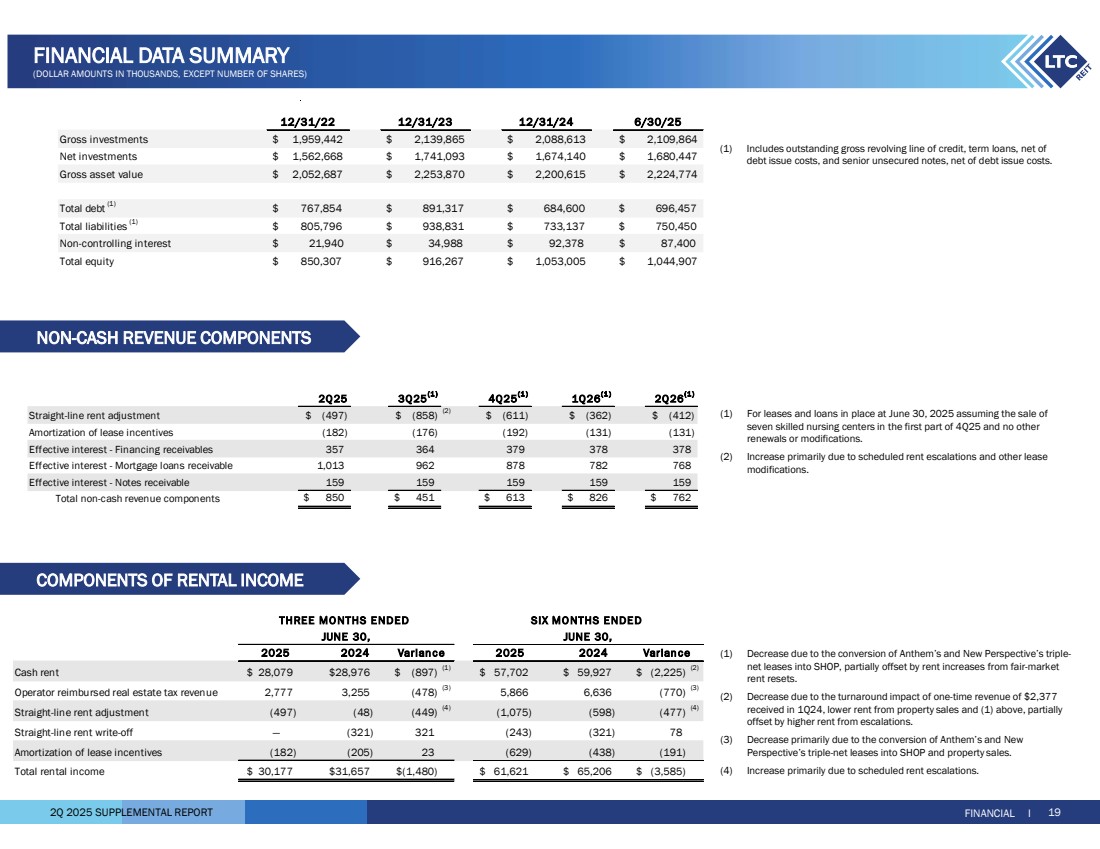
2Q 2025 SUPPLEMENTAL REPORT (1) For leases and loans in place at June 30, 2025 assuming the sale of seven skilled nursing centers in the first part of 4Q25 and no other renewals or modifications. (2) Increase primarily due to scheduled rent escalations and other lease modifications. (1) Decrease due to the conversion of Anthem’s and New Perspective’s triple-net leases into SHOP, partially offset by rent increases from fair-market rent resets. (2) Decrease due to the turnaround impact of one-time revenue of $2,377 received in 1Q24, lower rent from property sales and (1) above, partially offset by higher rent from escalations. (3) Decrease primarily due to the conversion of Anthem’s and New Perspective’s triple-net leases into SHOP and property sales. (4) Increase primarily due to scheduled rent escalations. COMPONENTS OF RENTAL INCOME FINANCIAL I 19 FINANCIAL DATA SUMMARY (DOLLAR AMOUNTS IN THOUSANDS, EXCEPT NUMBER OF SHARES) 12/31/22 12/31/23 12/31/24 6/30/25 Gross investments $ 1,959,442 $ 2,139,865 $ 2,088,613 $ 2,109,864 Net investments $ 1,562,668 $ 1,741,093 $ 1,674,140 $ 1,680,447 Gross asset value $ 2,052,687 $ 2,253,870 $ 2,200,615 $ 2,224,774 Total debt (1) $ 767,854 $ 891,317 $ 684,600 $ 696,457 Total liabilities (1) $ 805,796 $ 938,831 $ 733,137 $ 750,450 Non-controlling interest $ 21,940 $ 34,988 $ 92,378 $ 87,400 Total equity $ 850,307 $ 916,267 $ 1,053,005 $ 1,044,907 Cash rent 28,079 $ 28,976 $ (897) $ (1) $ 59,927 57,702 $ (2,225) $ (2) Operator reimbursed real estate tax revenue 2,777 3,255 (478) (3) 5,866 6,636 (770) (3) Straight-line rent adjustment (497) (48) (449) (4) (1,075) (598) (477) (4) Straight-line rent write-off — (321) 321 (243) (321) 78 Amortization of lease incentives (182) (205) 23 (629) (438) (191) Total rental income 30,177 $ 31,657 $ (1,480) $ 61,621 $ 65,206 $ (3,585) $ 2025 2024 2025 2024 Varian c e Varian ce THREE MO NTHS ENDED SIX MO NTHS ENDED JUNE 30, JUNE 30, (1) Includes outstanding gross revolving line of credit, term loans, net of debt issue costs, and senior unsecured notes, net of debt issue costs. NON-CASH REVENUE COMPONENTS 2Q 25 3Q25(1 ) 4Q25(1 ) 1Q26(1 ) 2Q 26(1 ) $ (858) (497) $ (2) $ (362) (611) $ (412) $ Amortization of lease incentives (182) (176) (192) (131) (131) Effective interest - Financing receivables 357 364 379 378 378 Effective interest - Mortgage loans receivable 1,013 962 878 782 768 Effective interest - Notes receivable 159 159 159 159 159 $ 850 $ 451 $ 613 $ 826 $ 762 Straight-line rent adjustment Total non-cash revenue components |
|
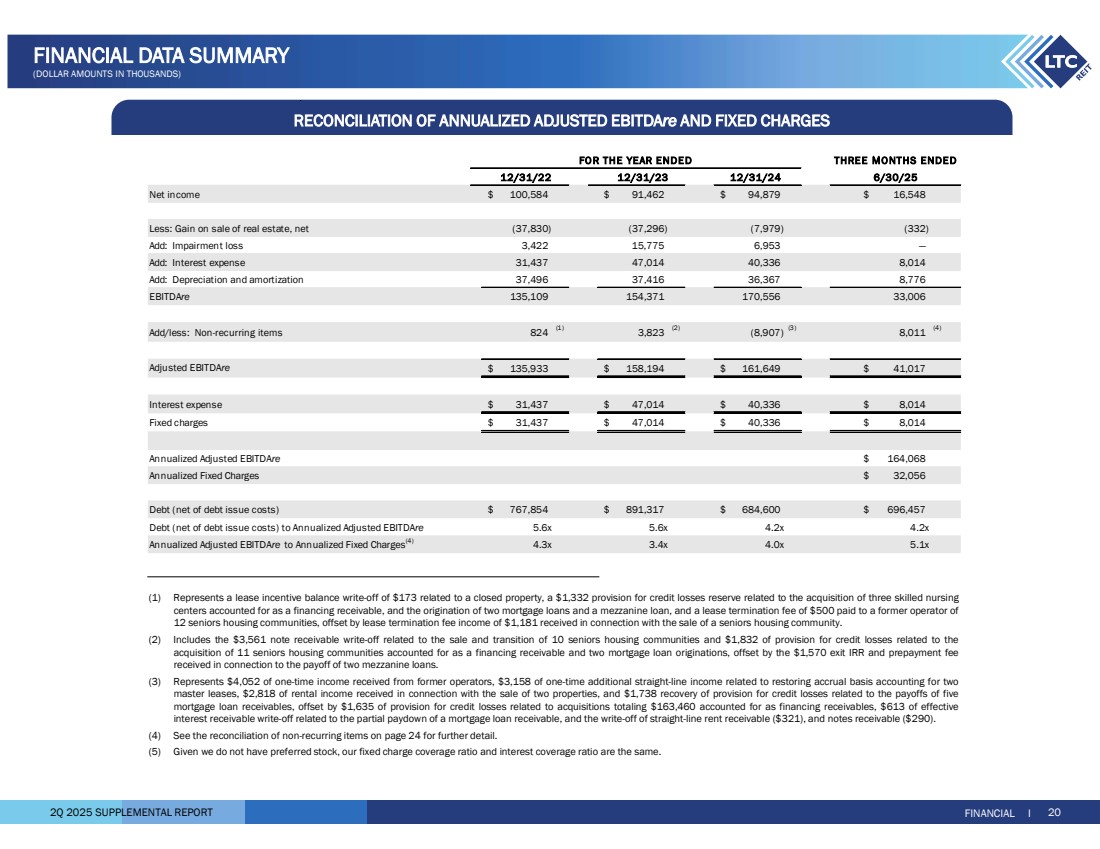
2Q 2025 SUPPLEMENTAL REPORT RECONCILIATION OF ANNUALIZED ADJUSTED EBITDAre AND FIXED CHARGES FINANCIAL I 20 FINANCIAL DATA SUMMARY (DOLLAR AMOUNTS IN THOUSANDS) 12/31/24 Net income 100,584 $ 91,462 $ 94,879 $ 16,548 $ Less: Gain on sale of real estate, net (37,830) (37,296) (7,979) (332) Add: Impairment loss 3,422 15,775 6,953 — Add: Interest expense 31,437 47,014 40,336 8,014 Add: Depreciation and amortization 37,496 37,416 36,367 8,776 EBITDAre 154,371 135,109 170,556 33,006 Add/less: Non-recurring items 824 (1) 3,823 (2) (8,907) (3) 8,011 (4) Adjusted EBITDAre $ 158,194 135,933 $ 161,649 $ 41,017 $ Interest expense 31,437 $ 47,014 $ 40,336 $ 8,014 $ Fixed charges 31,437 $ 47,014 $ 40,336 $ 8,014 $ Annualized Adjusted EBITDAre $ 164,068 Annualized Fixed Charges 32,056 $ Debt (net of debt issue costs) 767,854 $ 891,317 $ 684,600 $ 696,457 $ Debt (net of debt issue costs) to Annualized Adjusted EBITDAre 5.6x 5.6x 4.2x 4.2x Annualized Adjusted EBITDAre to Annualized Fixed Charges(4) 4.3x 3.4x 4.0x 5.1x FO R THE YEAR ENDED THREE MONTHS ENDED 12/31/22 12/31/23 6/30/25 (1) Represents a lease incentive balance write-off of $173 related to a closed property, a $1,332 provision for credit losses reserve related to the acquisition of three skilled nursing centers accounted for as a financing receivable, and the origination of two mortgage loans and a mezzanine loan, and a lease termination fee of $500 paid to a former operator of 12 seniors housing communities, offset by lease termination fee income of $1,181 received in connection with the sale of a seniors housing community. (2) Includes the $3,561 note receivable write-off related to the sale and transition of 10 seniors housing communities and $1,832 of provision for credit losses related to the acquisition of 11 seniors housing communities accounted for as a financing receivable and two mortgage loan originations, offset by the $1,570 exit IRR and prepayment fee received in connection to the payoff of two mezzanine loans. (3) Represents $4,052 of one-time income received from former operators, $3,158 of one-time additional straight-line income related to restoring accrual basis accounting for two master leases, $2,818 of rental income received in connection with the sale of two properties, and $1,738 recovery of provision for credit losses related to the payoffs of five mortgage loan receivables, offset by $1,635 of provision for credit losses related to acquisitions totaling $163,460 accounted for as financing receivables, $613 of effective interest receivable write-off related to the partial paydown of a mortgage loan receivable, and the write-off of straight-line rent receivable ($321), and notes receivable ($290). (4) See the reconciliation of non-recurring items on page 24 for further detail. (5) Given we do not have preferred stock, our fixed charge coverage ratio and interest coverage ratio are the same. |
|
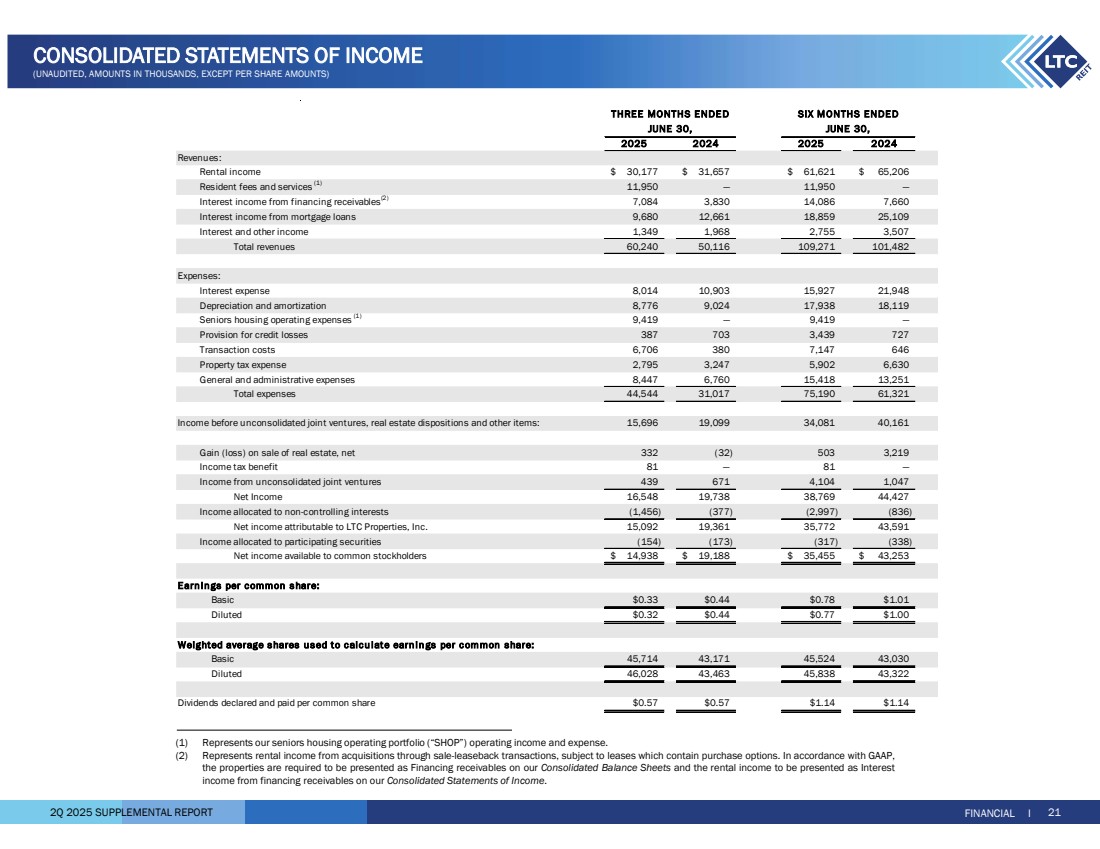
2Q 2025 SUPPLEMENTAL REPORT FINANCIAL I 21 CONSOLIDATED STATEMENTS OF INCOME (UNAUDITED, AMOUNTS IN THOUSANDS, EXCEPT PER SHARE AMOUNTS) (1) Represents our seniors housing operating portfolio (“SHOP”) operating income and expense. (2) Represents rental income from acquisitions through sale-leaseback transactions, subject to leases which contain purchase options. In accordance with GAAP, the properties are required to be presented as Financing receivables on our Consolidated Balance Sheets and the rental income to be presented as Interest income from financing receivables on our Consolidated Statements of Income. 2025 2024 2025 2024 Revenues: Rental income 30,177 $ 31,657 $ 61,621 $ 65,206 $ Resident fees and services (1) 11,950 — 11,950 — Interest income from financing receivables(2) 7,084 3,830 14,086 7,660 Interest income from mortgage loans 9,680 12,661 18,859 25,109 Interest and other income 1,349 1,968 2,755 3,507 Total revenues 60,240 50,116 109,271 101,482 Expenses: Interest expense 8,014 10,903 15,927 21,948 Depreciation and amortization 8,776 9,024 17,938 18,119 Seniors housing operating expenses (1) — 9,419 9,419 — Provision for credit losses 387 703 3,439 727 Transaction costs 6,706 380 7,147 646 Property tax expense 2,795 3,247 5,902 6,630 General and administrative expenses 8,447 6,760 15,418 13,251 Total expenses 44,544 31,017 75,190 61,321 15,696 19,099 34,081 40,161 Gain (loss) on sale of real estate, net 332 (32) 503 3,219 Income tax benefit 81 — 81 — Income from unconsolidated joint ventures 439 671 4,104 1,047 Net Income 16,548 19,738 38,769 44,427 Income allocated to non-controlling interests (1,456) (377) (2,997) (836) Net income attributable to LTC Properties, Inc. 15,092 19,361 35,772 43,591 Income allocated to participating securities (154) (173) (317) (338) Net income available to common stockholders 14,938 $ 19,188 $ 35,455 $ 43,253 $ Earnings per common s hare: Basic $0.33 $0.44 $0.78 $1.01 Diluted $0.32 $0.44 $0.77 $1.00 Weighted average shares u sed to c alcu late earnin gs per c ommon share: Basic 45,714 43,171 45,524 43,030 Diluted 46,028 43,463 45,838 43,322 Dividends declared and paid per common share $0.57 $0.57 $1.14 $1.14 Income before unconsolidated joint ventures, real estate dispositions and other items: THREE MONTHS ENDE D JUNE 30, JUNE 30, SIX MONTHS ENDED |
|
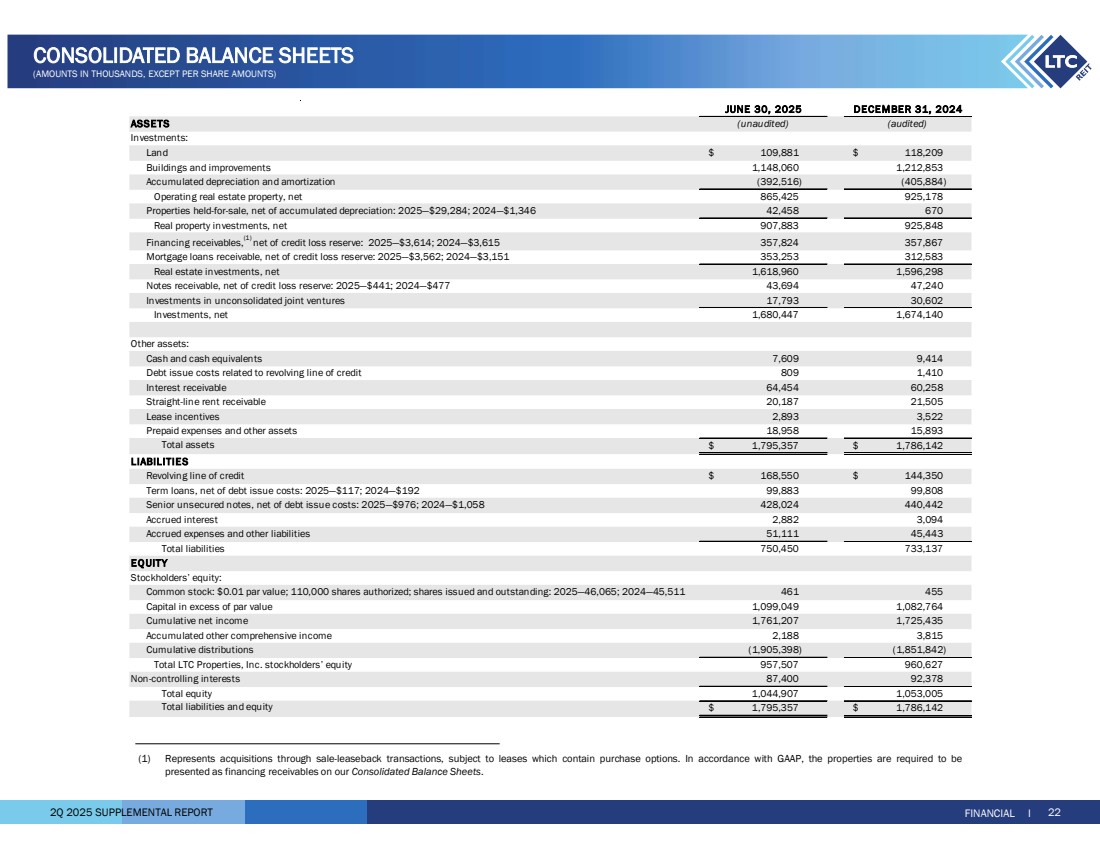
2Q 2025 SUPPLEMENTAL REPORT FINANCIAL I 22 CONSOLIDATED BALANCE SHEETS (AMOUNTS IN THOUSANDS, EXCEPT PER SHARE AMOUNTS) ASSETS Investments: Land $ 109,881 $ 118,209 Buildings and improvements 1,148,060 1,212,853 Accumulated depreciation and amortization (392,516) (405,884) Operating real estate property, net 865,425 925,178 Properties held-for-sale, net of accumulated depreciation: 2025—$29,284; 2024—$1,346 42,458 670 Real property investments, net 907,883 925,848 Financing receivables,(1) net of credit loss reserve: 2025—$3,614; 2024—$3,615 357,824 357,867 Mortgage loans receivable, net of credit loss reserve: 2025—$3,562; 2024—$3,151 353,253 312,583 Real estate investments, net 1,618,960 1,596,298 Notes receivable, net of credit loss reserve: 2025—$441; 2024—$477 43,694 47,240 Investments in unconsolidated joint ventures 17,793 30,602 Investments, net 1,680,447 1,674,140 Other assets: Cash and cash equivalents 7,609 9,414 Debt issue costs related to revolving line of credit 809 1,410 Interest receivable 64,454 60,258 Straight-line rent receivable 20,187 21,505 Lease incentives 2,893 3,522 Prepaid expenses and other assets 18,958 15,893 Total assets $ 1,795,357 $ 1,786,142 LIABILITIES Revolving line of credit $ 168,550 $ 144,350 Term loans, net of debt issue costs: 2025—$117; 2024—$192 99,883 99,808 Senior unsecured notes, net of debt issue costs: 2025—$976; 2024—$1,058 428,024 440,442 Accrued interest 2,882 3,094 Accrued expenses and other liabilities 51,111 45,443 Total liabilities 750,450 733,137 EQ UITY Stockholders’ equity: Common stock: $0.01 par value; 110,000 shares authorized; shares issued and outstanding: 2025—46,065; 2024—45,511 461 455 Capital in excess of par value 1,099,049 1,082,764 Cumulative net income 1,761,207 1,725,435 Accumulated other comprehensive income 2,188 3,815 Cumulative distributions (1,905,398) (1,851,842) Total LTC Properties, Inc. stockholders’ equity 957,507 960,627 Non-controlling interests 87,400 92,378 Total equity 1,044,907 1,053,005 Total liabilities and equity $ 1,795,357 $ 1,786,142 (unaudited) (audited) JUNE 30, 2025 DECEMBER 31, 2024 (1) Represents acquisitions through sale-leaseback transactions, subject to leases which contain purchase options. In accordance with GAAP, the properties are required to be presented as financing receivables on our Consolidated Balance Sheets. |
|
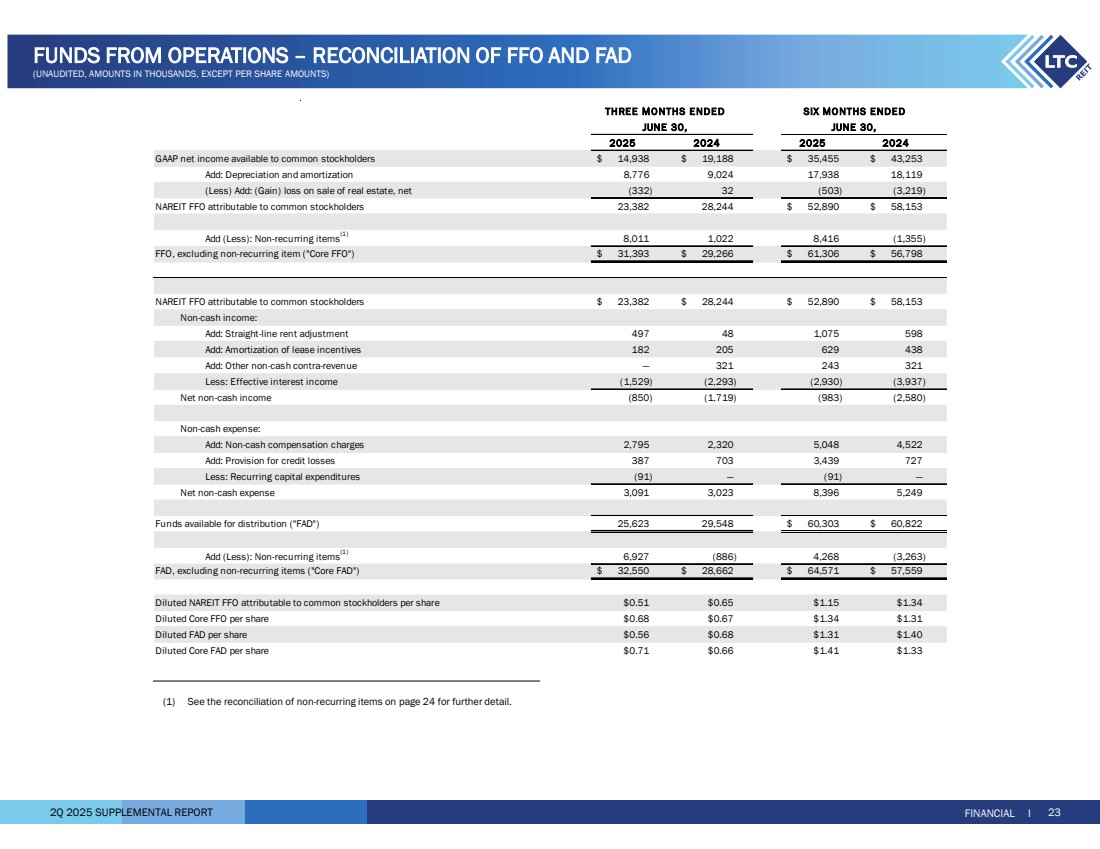
2Q 2025 SUPPLEMENTAL REPORT FINANCIAL I 23 FUNDS FROM OPERATIONS – RECONCILIATION OF FFO AND FAD (UNAUDITED, AMOUNTS IN THOUSANDS, EXCEPT PER SHARE AMOUNTS) 2025 2024 2025 2024 GAAP net income available to common stockholders 14,938 $ 19,188 $ 35,455 $ 43,253 $ Add: Depreciation and amortization 8,776 9,024 17,938 18,119 (Less) Add: (Gain) loss on sale of real estate, net (332) 32 (503) (3,219) NAREIT FFO attributable to common stockholders 23,382 28,244 52,890 $ 58,153 $ Add (Less): Non-recurring items(1) 1,022 8,011 8,416 (1,355) $ 29,266 31,393 $ 61,306 $ 56,798 $ NAREIT FFO attributable to common stockholders 23,382 $ 28,244 $ 52,890 $ 58,153 $ Non-cash income: Add: Straight-line rent adjustment 497 48 1,075 598 Add: Amortization of lease incentives 182 205 629 438 Add: Other non-cash contra-revenue — 321 243 321 Less: Effective interest income (1,529) (2,293) (2,930) (3,937) Net non-cash income (850) (1,719) (983) (2,580) Non-cash expense: Add: Non-cash compensation charges 2,795 2,320 5,048 4,522 Add: Provision for credit losses 387 703 3,439 727 Less: Recurring capital expenditures (91) — (91) — Net non-cash expense 3,091 3,023 8,396 5,249 Funds available for distribution ("FAD") 25,623 29,548 60,303 $ 60,822 $ Add (Less): Non-recurring items(1) (886) 6,927 4,268 (3,263) FAD, excluding non-recurring items ("Core FAD") 32,550 $ 28,662 $ 64,571 $ 57,559 $ $0.51 $0.65 $1.15 $1.34 $0.68 $0.67 $1.34 $1.31 $0.56 $0.68 $1.31 $1.40 $0.71 $0.66 $1.41 $1.33 THREE MONTHS ENDED SIX MO NTHS ENDED JUNE 30, JUNE 30, Diluted NAREIT FFO attributable to common stockholders per share Diluted Core FFO per share Diluted FAD per share Diluted Core FAD per share FFO, excluding non-recurring item ("Core FFO") (1) See the reconciliation of non-recurring items on page 24 for further detail. |
|
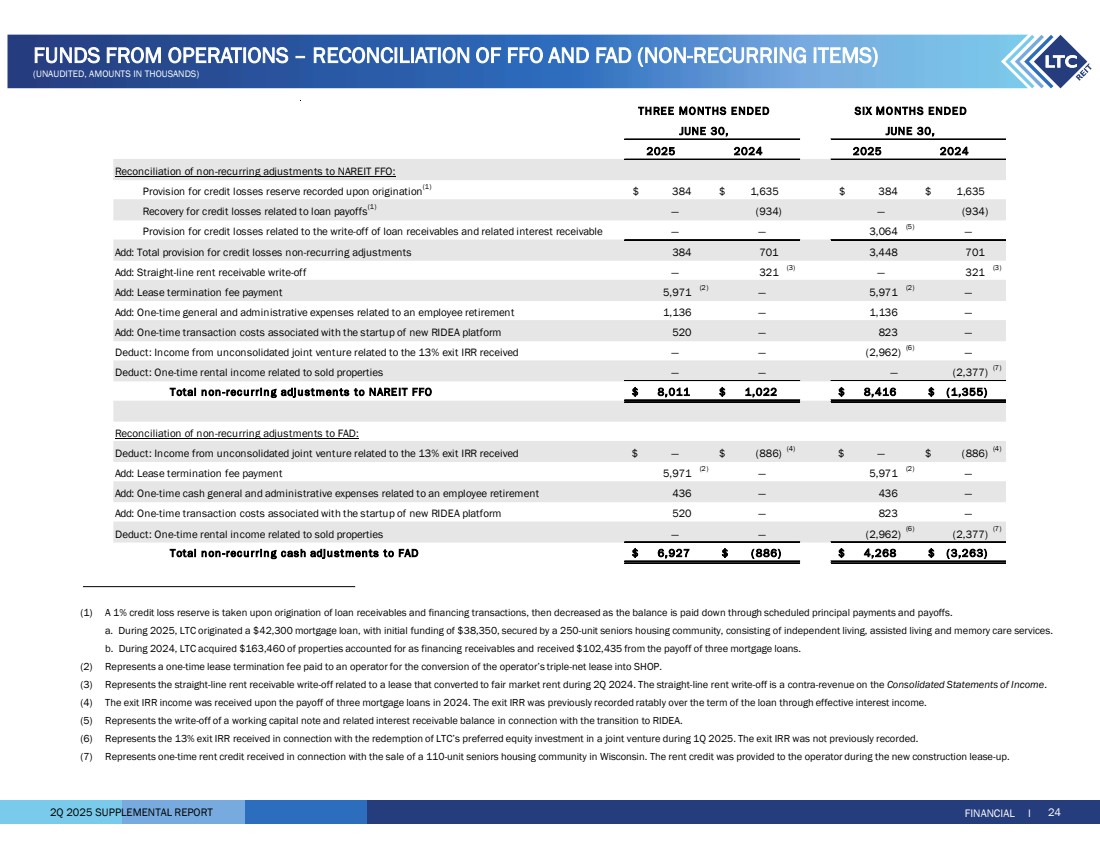
2Q 2025 SUPPLEMENTAL REPORT 2025 2024 2025 2024 Reconciliation of non-recurring adjustments to NAREIT FFO: Provision for credit losses reserve recorded upon origination(1) $ 1,635 384 $ 384 $ 1,635 $ Recovery for credit losses related to loan payoffs(1) (934) — — (934) Provision for credit losses related to the write-off of loan receivables and related interest receivable — — 3,064 (5) — Add: Total provision for credit losses non-recurring adjustments 384 701 3,448 701 Add: Straight-line rent receivable write-off — 321 (3) 321 — (3) Add: Lease termination fee payment 5,971 (2) 5,971 — (2) — Add: One-time general and administrative expenses related to an employee retirement 1,136 — 1,136 — Add: One-time transaction costs associated with the startup of new RIDEA platform 520 — 823 — Deduct: Income from unconsolidated joint venture related to the 13% exit IRR received — — (2,962) (6) — Deduct: One-time rental income related to sold properties — — — (2,377) (7) Total n on -recurrin g adju stmen ts to NAREIT FFO 8,011 $ 1,022 $ 8,416 $ (1,355) $ Reconciliation of non-recurring adjustments to FAD: Deduct: Income from unconsolidated joint venture related to the 13% exit IRR received — $ (886) $ (4) $ (886) — $ (4) Add: Lease termination fee payment 5,971 (2) 5,971 — (2) — Add: One-time cash general and administrative expenses related to an employee retirement 436 — 436 — Add: One-time transaction costs associated with the startup of new RIDEA platform 520 — 823 — Deduct: One-time rental income related to sold properties — — (2,962) (6) (2,377) (7) Total n on -recurrin g cash adju stments to FAD 6,927 $ ( 886) $ 4,268 $ (3,263) $ JUNE 30, THREE MONTHS ENDED SIX MONTHS ENDED JUNE 30, FINANCIAL I 24 FUNDS FROM OPERATIONS – RECONCILIATION OF FFO AND FAD (NON-RECURRING ITEMS) (UNAUDITED, AMOUNTS IN THOUSANDS) (1) A 1% credit loss reserve is taken upon origination of loan receivables and financing transactions, then decreased as the balance is paid down through scheduled principal payments and payoffs. a. During 2025, LTC originated a $42,300 mortgage loan, with initial funding of $38,350, secured by a 250-unit seniors housing community, consisting of independent living, assisted living and memory care services. b. During 2024, LTC acquired $163,460 of properties accounted for as financing receivables and received $102,435 from the payoff of three mortgage loans. (2) Represents a one-time lease termination fee paid to an operator for the conversion of the operator’s triple-net lease into SHOP. (3) Represents the straight-line rent receivable write-off related to a lease that converted to fair market rent during 2Q 2024. The straight-line rent write-off is a contra-revenue on the Consolidated Statements of Income. (4) The exit IRR income was received upon the payoff of three mortgage loans in 2024. The exit IRR was previously recorded ratably over the term of the loan through effective interest income. (5) Represents the write-off of a working capital note and related interest receivable balance in connection with the transition to RIDEA. (6) Represents the 13% exit IRR received in connection with the redemption of LTC’s preferred equity investment in a joint venture during 1Q 2025. The exit IRR was not previously recorded. (7) Represents one-time rent credit received in connection with the sale of a 110-unit seniors housing community in Wisconsin. The rent credit was provided to the operator during the new construction lease-up. |
|
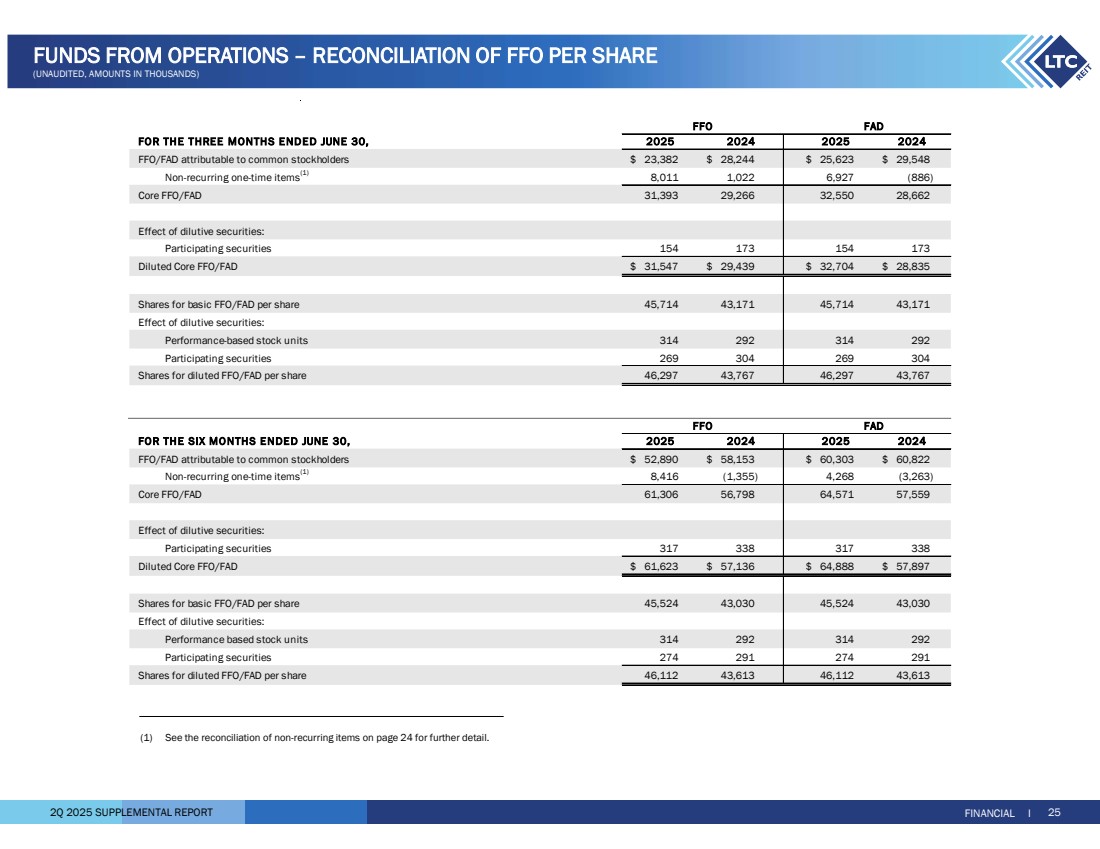
2Q 2025 SUPPLEMENTAL REPORT FOR THE THREE MONTHS ENDED JUNE 30, FFO/FAD attributable to common stockholders 23,382 $ 28,244 $ 25,623 $ 29,548 $ Non-recurring one-time items(1) 1,022 8,011 6,927 (886) Core FFO/FAD 31,393 29,266 32,550 28,662 Effect of dilutive securities: Participating securities 154 173 154 173 Diluted Core FFO/FAD 31,547 $ 29,439 $ 32,704 $ 28,835 $ 43,171 45,714 45,714 43,171 Effect of dilutive securities: Performance-based stock units 314 292 314 292 Participating securities 269 304 269 304 Shares for diluted FFO/FAD per share 46,297 43,767 46,297 43,767 FOR THE SIX MONTHS ENDED JUNE 30, FFO/FAD attributable to common stockholders 52,890 $ 58,153 $ 60,303 $ 60,822 $ Non-recurring one-time items(1) (1,355) 8,416 4,268 (3,263) Core FFO/FAD 61,306 56,798 64,571 57,559 Effect of dilutive securities: Participating securities 317 338 317 338 Diluted Core FFO/FAD 61,623 $ 57,136 $ 64,888 $ 57,897 $ 43,030 45,524 45,524 43,030 Effect of dilutive securities: Performance based stock units 314 292 314 292 Participating securities 274 291 274 291 Shares for diluted FFO/FAD per share 46,112 43,613 46,112 43,613 FAD 2025 2024 2025 2024 Shares for basic FFO/FAD per share 2025 2024 2024 Shares for basic FFO/FAD per share FFO FAD 2025 FFO FINANCIAL I 25 FUNDS FROM OPERATIONS – RECONCILIATION OF FFO PER SHARE (UNAUDITED, AMOUNTS IN THOUSANDS) (1) See the reconciliation of non-recurring items on page 24 for further detail. |
|
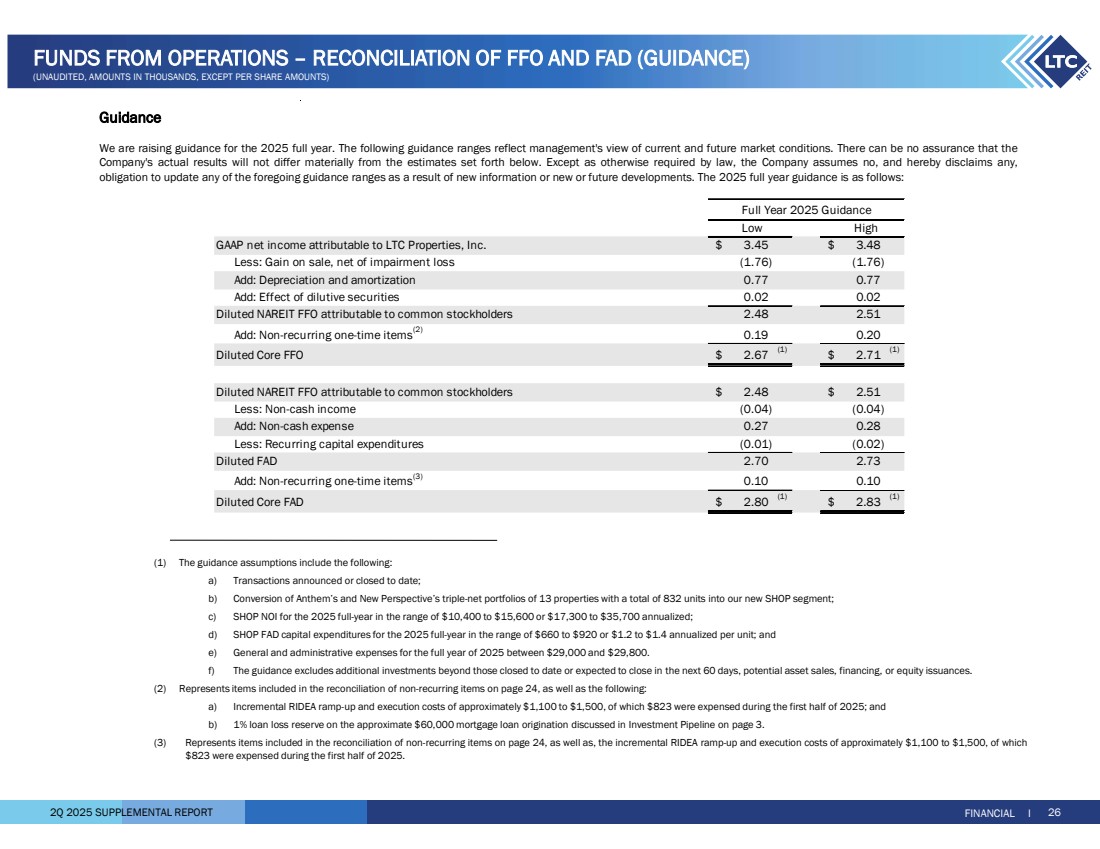
2Q 2025 SUPPLEMENTAL REPORT FINANCIAL I 26 Guidance We are raising guidance for the 2025 full year. The following guidance ranges reflect management's view of current and future market conditions. There can be no assurance that the Company's actual results will not differ materially from the estimates set forth below. Except as otherwise required by law, the Company assumes no, and hereby disclaims any, obligation to update any of the foregoing guidance ranges as a result of new information or new or future developments. The 2025 full year guidance is as follows: FUNDS FROM OPERATIONS – RECONCILIATION OF FFO AND FAD (GUIDANCE) (UNAUDITED, AMOUNTS IN THOUSANDS, EXCEPT PER SHARE AMOUNTS) Low High GAAP net income attributable to LTC Properties, Inc. 3.45 $ 3.48 $ Less: Gain on sale, net of impairment loss (1.76) (1.76) Add: Depreciation and amortization 0.77 0.77 Add: Effect of dilutive securities 0.02 0.02 Diluted NAREIT FFO attributable to common stockholders 2.48 2.51 Add: Non-recurring one-time items(2) 0.20 0.19 Diluted Core FFO 2.67 $ (1) $ 2.71 (1) Diluted NAREIT FFO attributable to common stockholders 2.48 $ 2.51 $ Less: Non-cash income (0.04) (0.04) Add: Non-cash expense 0.27 0.28 Less: Recurring capital expenditures (0.01) (0.02) Diluted FAD 2.70 2.73 Add: Non-recurring one-time items(3) 0.10 0.10 Diluted Core FAD 2.80 $ (1) $ 2.83 (1) Full Year 2025 Guidance (1) The guidance assumptions include the following: a) Transactions announced or closed to date; b) Conversion of Anthem’s and New Perspective’s triple-net portfolios of 13 properties with a total of 832 units into our new SHOP segment; c) SHOP NOI for the 2025 full-year in the range of $10,400 to $15,600 or $17,300 to $35,700 annualized; d) SHOP FAD capital expenditures for the 2025 full-year in the range of $660 to $920 or $1.2 to $1.4 annualized per unit; and e) General and administrative expenses for the full year of 2025 between $29,000 and $29,800. f) The guidance excludes additional investments beyond those closed to date or expected to close in the next 60 days, potential asset sales, financing, or equity issuances. (2) Represents items included in the reconciliation of non-recurring items on page 24, as well as the following: a) Incremental RIDEA ramp-up and execution costs of approximately $1,100 to $1,500, of which $823 were expensed during the first half of 2025; and b) 1% loan loss reserve on the approximate $60,000 mortgage loan origination discussed in Investment Pipeline on page 3. (3) Represents items included in the reconciliation of non-recurring items on page 24, as well as, the incremental RIDEA ramp-up and execution costs of approximately $1,100 to $1,500, of which $823 were expensed during the first half of 2025. |
|
2Q 2025 SUPPLEMENTAL REPORT Annualized Contractual Cash Income: Represents annualized contractual cash rental income (prior to abatements & deferred rent repayment and excludes real estate tax reimbursement), interest income from financing receivables, mortgage loans, mezzanine loans and working capital notes, and income from unconsolidated joint ventures for the month of June 2025 for investments as of June 30, 2025. Also, represents annualized projected 3Q 2025 SHOP NOI. Annualized GAAP Income: Represents annualized GAAP rent which includes contractual cash rent, straight-line rent and amortization of lease incentives and excludes real estate tax reimbursement, GAAP interest income from financing receivables, mortgage loans, mezzanine loans and working capital notes, and income from unconsolidated joint ventures for the month of June 2025 for investments as of June 30, 2025. Also, represents annualized projected 3Q 2025 SHOP NOI. Assisted Living Communities (“ALF”): The ALF portfolio consists of assisted living, independent living, and/or memory care properties. (See Independent Living and Memory Care) Assisted living properties are seniors housing properties serving elderly persons who require assistance with activities of daily living, but do not require the constant supervision skilled nursing properties provide. Services are usually available 24 hours a day and include personal supervision and assistance with eating, bathing, grooming and administering medication. The facilities provide a combination of housing, supportive services, personalized assistance and health care designed to respond to individual needs. Contractual Lease Rent: Rental revenue as defined by the lease agreement between us and the operator for the lease year. Coronavirus Stimulus Funds (“CSF”): CSF includes funding from various state and federal programs to support healthcare providers in dealing with the challenges of the coronavirus pandemic. Included in CSF are state-specific payments identified by operators as well as federal payments connected to the Paycheck Protection Program and the Provider Relief Fund. CSF is self-reported by operators in unaudited financial statements provided to LTC. Specifically excluded from CSF are the suspension of the Medicare sequestration cut, and increases to the Federal Medical Assistance Percentages (FMAP), both of which are reflected in reported coverage both including and excluding CSF. Earnings Before Interest, Tax, Depreciation and Amortization for Real Estate (“EBITDAre”): As defined by the National Association of Real Estate Investment Trusts (“NAREIT”), EBITDAre is calculated as net income (computed in accordance with GAAP) excluding (i) interest expense, (ii) income tax expense, (iii) real estate depreciation and amortization, (iv) impairment write-downs of depreciable real estate, (v) gains or losses on the sale of depreciable real estate, and (vi) adjustments for unconsolidated partnerships and joint ventures. Financing Receivables: Properties acquired through a sale-leaseback transaction with an operating entity being the same before and after the sale-leaseback, subject to a lease contract that contains a purchase option. In accordance with GAAP, the purchased assets are required to be presented as Financing Receivables on our Consolidated Balance Sheets and the rental income to be presented as Interest income from financing receivables on our Consolidated Statements of Income. Funds Available for Distribution (“FAD”): FFO excluding the effects of straight-line rent, amortization of lease costs, effective interest income, provision for credit losses, non-cash compensation charges, non-cash interest charges and recurring capital expenditures required to maintain and re-tenant our properties. Funds From Operations (“FFO”): As defined by NAREIT, net income available to common stockholders (computed in accordance with U.S. GAAP) excluding gains or losses on the sale of real estate and impairment write-downs of depreciable real estate plus real estate depreciation and amortization, and after adjustments for unconsolidated partnerships and joint ventures. GAAP Rent: Total rent we will receive as a fixed amount over the initial term of the lease and recognized evenly over that term. GAAP rent recorded in the early years of a lease is higher than the cash rent received and during the later years of the lease, the cash rent received is higher than GAAP rent recognized. The difference between the cash rent and GAAP rent is commonly referred to as straight-line rental income. GAAP rent also includes amortization of lease incentives and real estate tax reimbursements. Gross Asset Value: The carrying amount of total assets after adding back accumulated depreciation and loan loss reserves, as reported in the company’s consolidated financial statements. Gross Investment: Original price paid for an asset plus capital improvements funded by LTC, without any deductions for depreciation or provision for credit losses. Gross Investment is commonly referred to as undepreciated book value. Independent Living Communities (“ILF”): Seniors housing properties offering a sense of community and numerous levels of service, such as laundry, housekeeping, dining options/meal plans, exercise and wellness programs, transportation, social, cultural and recreational activities, on-site security and emergency response programs. Many offer on-site conveniences like beauty/barber shops, fitness facilities, game rooms, libraries and activity centers. ILFs are also known as retirement communities or seniors apartments. Interest Income: Represents interest income from financing receivables, mortgage loans and other notes. Licensed Beds/Units: The number of beds and/or units that an operator is authorized to operate at seniors housing and long-term care properties. Licensed beds and/or units may differ from the number of beds and/or units in service at any given time. Memory Care Communities (“MC”): Seniors housing properties offering specialized options for seniors with Alzheimer’s disease and other forms of dementia. These facilities offer dedicated care and specialized programming for various conditions relating to memory loss in a secured environment that is typically smaller in scale and more residential in nature than traditional assisted living facilities. These facilities have staff available 24 hours a day to respond to the unique needs of their residents. Metropolitan Statistical Areas (“MSA”): Based on the U.S. Census Bureau, MSA is a geographic entity defined by the Office of Management and Budget (OMB) for use by Federal statistical agencies in collecting, tabulating, and publishing Federal statistics. A metro area contains a core urban area of 50,000 or more population. MSAs 1 to 31 have a population of 19.8M – 2.2M. MSAs 32 to 100 have a population of 2.2M – 0.6M. MSAs greater than 100 have a population of 0.6M – 59K. Cities in a Micro-SA have a population of 223K – 12K. Cities not in a MSA has population of less than 100K. Mezzanine: Mezzanine financing sits between senior debt and common equity in the capital structure, and typically is used to finance development projects, value-add opportunities on existing operational properties, partnership buy-outs and recapitalization of equity. Security for mezzanine loans can include all or a portion of the following credit enhancements; secured second mortgage, pledge of equity interests and personal/corporate guarantees. Mezzanine loans can be recorded for GAAP purposes as either a loan or joint venture depending upon specifics of the loan terms and related credit enhancements. Micropolitan Statistical Areas (“Micro-SA”): Based on the U.S. Census Bureau, Micro-SA is a geographic entity defined by the Office of Management and Budget (OMB) for use by Federal statistical agencies in collecting, tabulating, and publishing Federal statistics. A micro area contains an urban core of at least 10,000 population. GLOSSARY I 27 GLOSSARY |
|
2Q 2025 SUPPLEMENTAL REPORT Mortgage Loan: Mortgage financing is provided on properties based on our established investment underwriting criteria and secured by a first mortgage. Subject to underwriting, additional credit enhancements may be required including, but not limited to, personal/corporate guarantees and debt service reserves. When possible, LTC attempts to negotiate a purchase option to acquire the property at a future time and lease the property back to the borrower. Net Real Estate Assets: Gross real estate investment less accumulated depreciation. Net Real Estate Asset is commonly referred to as Net Book Value (“NBV”). NNN – Triple-net lease which requires the lessee to pay all taxes, insurance, maintenance and repair capital and non-capital expenditures and other costs necessary in the operations of the property. Non-cash Revenue: Straight-line rental income, amortization of lease inducement and effective interest. Non-cash Compensation Charges: Vesting expense relating to restricted stock and performance-based stock units. Normalized EBITDAR Coverage: The trailing twelve month’s earnings from the operator financial statements adjusted for non-recurring, infrequent, or unusual items and before interest, taxes, depreciation, amortization, and rent divided by the operator’s contractual lease rent. Management fees are imputed at 5% of revenues. Normalized EBITDARM Coverage: The trailing twelve month’s earnings from the operator financial statements adjusted for non-recurring, infrequent, or unusual items and before interest, taxes, depreciation, amortization, rent, and management fees divided by the operator’s contractual lease rent. Occupancy: The weighted average percentage of all beds and/or units that are occupied at a given time. The calculation uses the trailing twelve months and is based on licensed beds and/or units which may differ from the number of beds and/or units in service at any given time. Operator Financial Statements: Property level operator financial statements which are unaudited and have not been independently verified by us. Payor Source: LTC revenue by operator underlying payor source for the period presented. LTC is not a Medicaid or a Medicare recipient. Statistics represent LTC's rental revenues times operators' underlying payor source revenue percentage. Underlying payor source revenue percentage is calculated from property level operator financial statements which are unaudited and have not been independently verified by us. Private Pay: Private pay includes private insurance, HMO, VA, and other payors. Purchase Price: Represents the fair value price of an asset that is exchanged in an orderly transaction between market participants at the measurement date. An orderly transaction is a transaction that assumes exposure to the market for a period prior to the measurement date to allow for marketing activities that are usual and customary for transactions involving such assets; it is not a forced transaction (for example, a forced liquidation or distress sale). Real Estate Investments: Represents our investments in real property, financing receivables, mortgage loans receivable and other notes receivables. Rental Income: Represents GAAP rent generated by our owned properties under triple-net leases. RIDEA: Real Estate Investment Trust (REIT) Investment Diversification and Empowerment Act of 2007 Same Property Portfolio (“SPP”): Same property statistics allow for the comparative evaluation of performance across a consistent population of LTC’s leased property portfolio and the Prestige Healthcare mortgage loan portfolio. Our SPP is comprised of stabilized properties occupied and operated throughout the duration of the quarter-over-quarter comparison periods presented (excluding assets sold, assets held-for-sale and SHOP assets). Accordingly, a property must be occupied and stabilized or a minimum of 15 months to be included in our SPP. Each property transitioned to a new operator has been excluded from SPP and will be added back to SPP for the SPP reporting period ending 15 months after the date of the transition. Seniors Housing (“SH”): Consists of independent living, assisted living, and/or memory care properties. Seniors Housing Operating Portfolio (“SHOP”): Includes Seniors Housing properties generally structured to comply with RIDEA. SHOP Net Operating Income (“NOI”): The difference between Resident fees and services and Property operating expense line items on our Consolidated Statements of Income. Skilled Nursing Properties (“SNF”): Seniors housing properties providing restorative, rehabilitative and nursing care for people not requiring the more extensive and sophisticated treatment available at acute care hospitals. Many SNFs provide ancillary services that include occupational, speech, physical, respiratory and IV therapies, as well as sub-acute care services which are paid either by the patient, the patient’s family, private health insurance, or through the federal Medicare or state Medicaid programs. Stabilized: Properties are generally considered stabilized upon the earlier of achieving certain occupancy thresholds (e.g. 80% for SNFs and 90% for ALFs) and, as applicable, 12 months from the date of acquisition/lease transition or, in the event of a de novo development, redevelopment, major renovations or addition, 24 months from the date the property is first placed in or returned to service, or properties acquired in lease-up. Trailing Twelve Months NOI: For the owned portfolio under triple-net leases, rental income excluding real estate tax reimbursement, straight-line rent write-off and rental income from properties sold during the trailing twelve months. For the owned portfolio under our SHOP segment, represents SHOP NOI during the trailing twelve months. For owned properties accounted for as a financing receivables, mortgage loan receivables and notes receivables, NOI includes cash interest income and effective interest during the trailing twelve months and excludes loan payoffs during the trailing twelve months. For Unconsolidated JV, NOI includes income from our investments in joint ventures during the trailing twelve months. Under Development Properties (“UDP”): Development projects to construct seniors housing properties. GLOSSARY I 28 GLOSSARY |
|
2Q 2025 SUPPLEMENTAL REPORT FORWARD-LOOKING STATEMENTS This supplemental information contains forward-looking statements within the meaning of Section 27A of the Securities Act of 1933, as amended, and Section 21E of the Securities Exchange Act of 1934, as amended, adopted pursuant to the Private Securities Litigation Reform Act of 1995. Statements that are not purely historical may be forward-looking. You can identify some of the forward-looking statements by their use of forward-looking words, such as ‘‘believes,’’ ‘‘expects,’’ ‘‘may,’’ ‘‘will,’’ ‘‘should,’’ ‘‘seeks,’’ ‘‘approximately,’’ ‘‘intends,’’ ‘‘plans,’’ ‘‘estimates’’ or ‘‘anticipates,’’ or the negative of those words or similar words. Examples of forward-looking statements include the Company’s 2025 full-year guidance and statements regarding the Company’s SHOP pipeline, anticipated growth, and future strategy. Forward- looking statements involve inherent risks and uncertainties regarding events, conditions and financial trends that may affect our future plans of operation, business strategy, results of operations and financial position. A number of important factors could cause actual results to differ materially from those included within or contemplated by such forward-looking statements, including, but not limited to, our dependence on our operators for revenue and cash flow; government regulation of the health care industry; changes in federal, state, or local laws limiting REIT investments in the health care sector; federal and state health care cost containment measures including reductions in reimbursement from third-party payors such as Medicare and Medicaid; required regulatory approvals for operation of health care facilities; a failure to comply with federal, state, or local regulations for the operation of health care facilities; the adequacy of insurance coverage maintained by our operators; our reliance on a few major operators; our ability to renew leases or enter into favorable terms of renewals or new leases; the impact of inflation, operator financial or legal difficulties; the sufficiency of collateral securing mortgage loans; an impairment of our real estate investments; the relative illiquidity of our real estate investments; our ability to develop and complete construction projects; our ability to invest cash proceeds for health care properties; a failure to qualify as a REIT; our ability to grow if access to capital is limited; and a failure to maintain or increase our dividend. For a discussion of these and other factors that could cause actual results to differ from those contemplated in the forward-looking statements, please see the discussion under ‘‘Risk Factors’’ and other information contained in our Annual Report on Form 10-K for the fiscal year ended December 31, 2024 and in our publicly available filings with the Securities and Exchange Commission. We do not undertake any responsibility to update or revise any of these factors or to announce publicly any revisions to forward-looking statements, whether as a result of new information, future events or otherwise. Although our management believes that the assumptions and expectations reflected in such forward-looking statements are reasonable, no assurance can be given that such expectations will prove to have been correct. The actual results achieved may differ materially from any forward-looking statements due to the risks and uncertainties of such statements. 29 Founded in 1992, LTC Properties, Inc. (NYSE: LTC) is a self-administered real estate investment trust (REIT) investing in seniors housing and health care properties primarily through RIDEA, triple-net leases, joint ventures and structured finance solutions including preferred equity and mezzanine lending. LTC’s portfolio encompasses Skilled Nursing Facilities (SNF) and Seniors Housing (SH) consisting of Assisted Living Communities (ALF), Independent Living Communities (ILF), Memory Care Communities (MC) and combinations thereof. Our main objective is to build and grow a diversified portfolio that creates and sustains shareholder value while providing our stockholders current distribution income. To meet this objective, we seek properties operated by regional operators, ideally offering upside and portfolio diversification (geographic, operator, property type and investment vehicle). For more information, visit www.LTCreit.com. FORWARD-LOOKING STATEMENTS AND NON-GAAP INFORMATION NON-GAAP INFORMATION This supplemental information contains certain non-GAAP information including EBITDAre, adjusted EBITDAre, FFO, FFO excluding non-recurring items, FAD, FAD excluding non-recurring items, adjusted interest coverage ratio, and adjusted fixed charges coverage ratio. A reconciliation of this non-GAAP information is provided on pages 20, 23, 24 and 25 of this supplemental information, and additional information is available under the “Non-GAAP Financial Measures” subsection under the “Filings” section of our website at www.LTCreit.com. |