EX-99.2
Published on May 6, 2026
Exhibit 99.2
| RENEWAL AND TRANSITION SUPPLEMENTAL OPERATING AND FINANCIAL DATA FIRST QUARTER 2026 |
| 1Q26 SUPPLEMENTAL REPORT INVESTMENTS 3 Seniors Housing Operating Portfolio ("SHOP") Transformation Portfolio Transformation Acquisitions and Mortgage Loans Near-Term Loan Payoffs Expected & Purchase Options to be Exercised PORTFOLIO 7 Portfolio Overview Operator Update and Subsequent Events Portfolio Diversification - Geography SHOP Performance and Guidance Real Estate Investments (Excluding SHOP) Diversification - Operators Real Estate Investments (Excluding SHOP) - Maturity Real Estate Investments (Excluding SHOP) - Metrics FINANCIAL 16 Enterprise Value Debt Metrics Debt Maturity Reconciliation of 2026 Guidance Financial Data Summary Consolidated Statements of Income Consolidated Balance Sheets Funds from Operations GLOSSARY 28 FORWARD-LOOKING STATEMENTS 30 AND NON-GAAP INFORMATION 2 LEADERSHIP Any opinions, estimates, or forecasts regarding LTC’s performance made by the analysts listed above do not represent the opinions, estimates, and forecasts of LTC or its management. BOARD OF DIRECTORS ANALYSTS LTC PROPERTIES, INC. 3011 Townsgate Road, Suite 220 Westlake Village, CA 91361 805-981-8655 www.LTCreit.com TRANSFER AGENT Broadridge Shareholder Services c/o Broadridge Corporate Issuer Solutions 1155 Long Island Avenue Edgewood, NY 11717-8309 ATTN: IWS 866-708-5586 WENDY SIMPSON Executive Chairman CORNELIA CHENG Sustainability and Corporate Responsibility Committee Chairman DAVID GRUBER Investment Committee Chairman JEFFREY HAWKEN Compensation Committee Chairman BRADLEY PREBER Audit Committee Chairman TIMOTHY TRICHE, MD Lead Independent Director and Nominating & Corporate Governance Committee Chairman JUAN SANABRIA BMO Capital Markets Corp. RICHARD ANDERSON Cantor Fitzgerald AARON HECHT Citizens JMP Securities, LLC OMOTAYO OKUSANYA Deutsche Bank Securities Inc. JOE DICKSTEIN Jefferies LLC AUSTIN WURSCHMIDT KeyBanc Capital Markets, Inc. MICHAEL CARROLL RBC Capital Markets Corp. JOHN KILICHOWSKI Wells Fargo Securities, LLC WENDY SIMPSON Executive Chairman PAM KESSLER Co-President and Co-CEO CLINT MALIN Co-President and Co-CEO CECE CHIKHALE EVP, Chief Financial Officer, Treasurer and Secretary DAVID BOITANO EVP, Chief Investment Officer GIBSON SATTERWHITE EVP, Asset Management MIKE BOWDEN SVP, Investments MANDI HOGAN SVP, Marketing TABLE OF CONTENTS CONTACT INFORMATION |

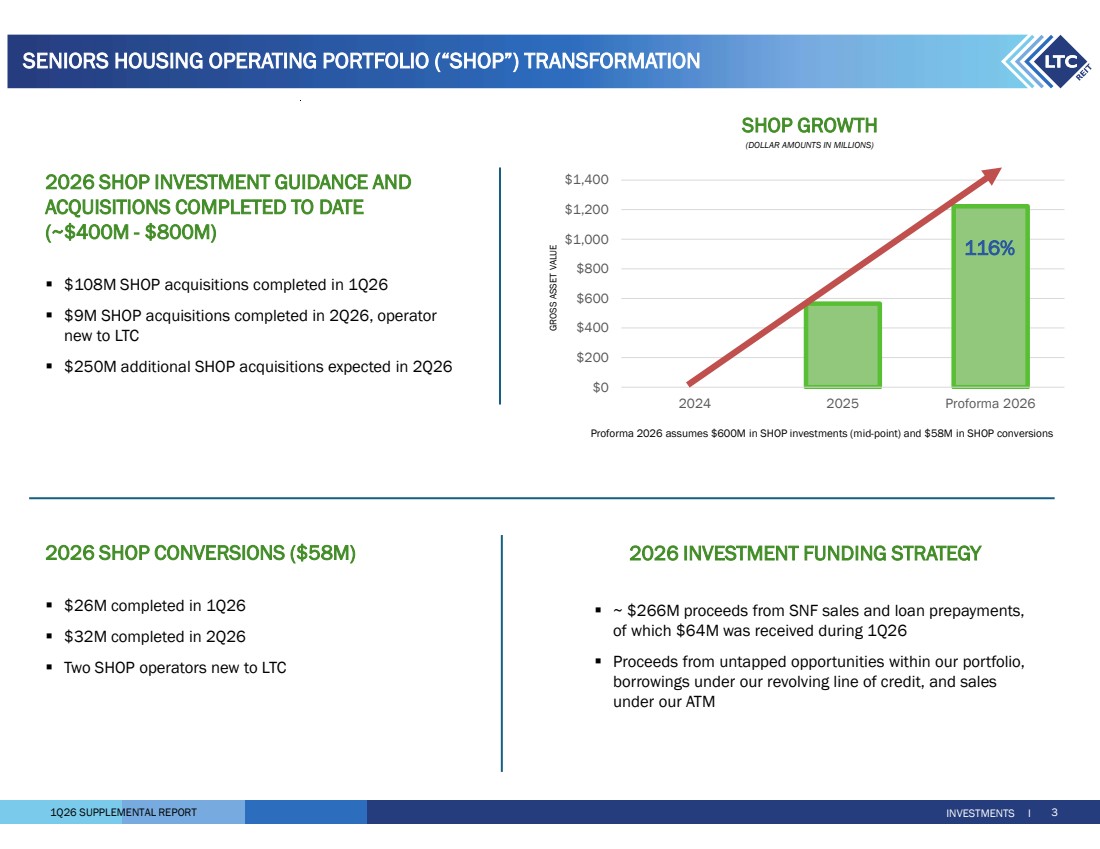
| 1Q26 SUPPLEMENTAL REPORT INVESTMENTS I 3 SENIORS HOUSING OPERATING PORTFOLIO (“SHOP”) TRANSFORMATION 2026 INVESTMENT FUNDING STRATEGY ~ $266M proceeds from SNF sales and loan prepayments, of which $64M was received during 1Q26 Proceeds from untapped opportunities within our portfolio, borrowings under our revolving line of credit, and sales under our ATM 2026 SHOP INVESTMENT GUIDANCE AND ACQUISITIONS COMPLETED TO DATE (~$400M - $800M) $108M SHOP acquisitions completed in 1Q26 $9M SHOP acquisitions completed in 2Q26, operator new to LTC $250M additional SHOP acquisitions expected in 2Q26 SHOP GROWTH (DOLLAR AMOUNTS IN MILLIONS) $0 $200 $400 $600 $800 $1,000 $1,200 $1,400 2024 2025 Proforma 2026 GROSS ASSET VALUE Proforma 2026 assumes $600M in SHOP investments (mid-point) and $58M in SHOP conversions 116% 2026 SHOP CONVERSIONS ($58M) $26M completed in 1Q26 $32M completed in 2Q26 Two SHOP operators new to LTC |
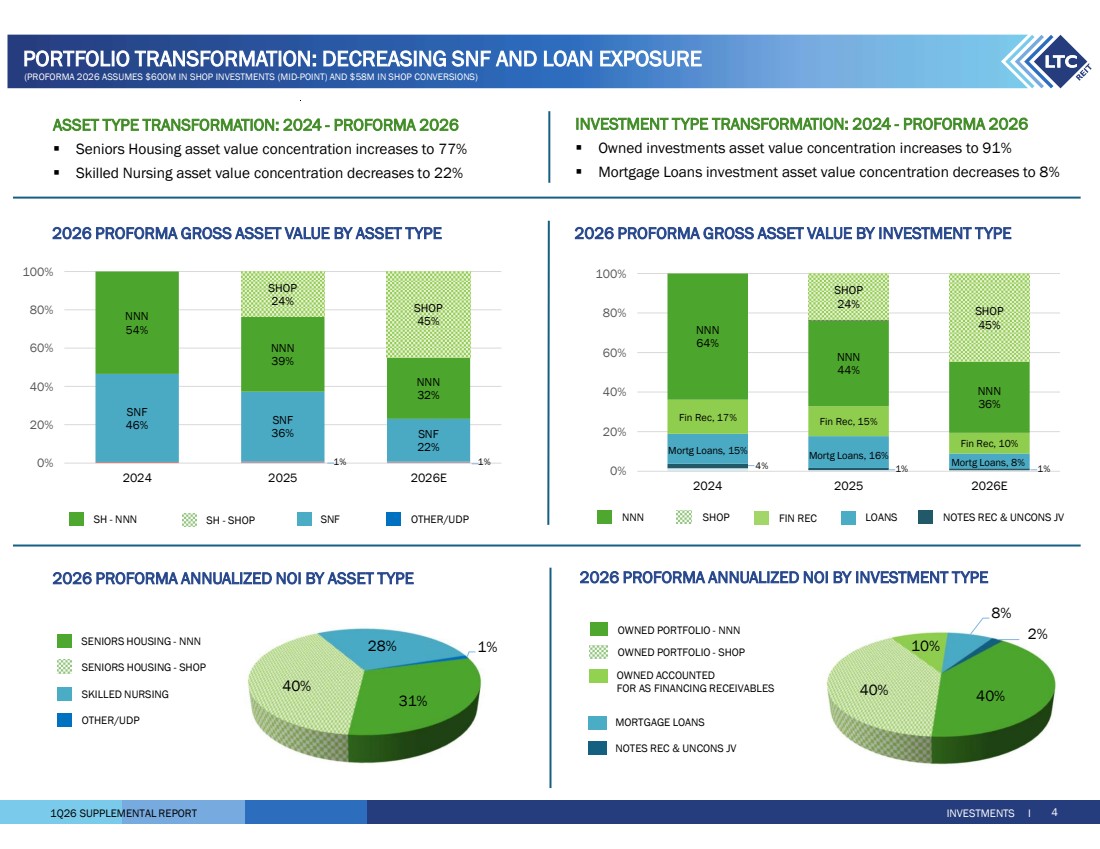
| 1Q26 SUPPLEMENTAL REPORT Mortg Loans, 15% Mortg Loans, 16% Mortg Loans, 8% Fin Rec, 17% Fin Rec, 15% Fin Rec, 10% NNN 64% NNN 44% NNN 36% SHOP 24% SHOP 45% 0% 20% 40% 60% 80% 100% 2024 2025 2026E NNN SHOP FIN REC LOANS NOTES REC & UNCONS JV INVESTMENTS I 4 PORTFOLIO TRANSFORMATION: DECREASING SNF AND LOAN EXPOSURE 2026 PROFORMA GROSS ASSET VALUE BY ASSET TYPE 2026 PROFORMA GROSS ASSET VALUE BY INVESTMENT TYPE ASSET TYPE TRANSFORMATION: 2024 - PROFORMA 2026 Seniors Housing asset value concentration increases to 77% Skilled Nursing asset value concentration decreases to 22% INVESTMENT TYPE TRANSFORMATION: 2024 - PROFORMA 2026 Owned investments asset value concentration increases to 91% Mortgage Loans investment asset value concentration decreases to 8% 40% 40% 10% 8% OWNED PORTFOLIO - NNN 2% OWNED ACCOUNTED FOR AS FINANCING RECEIVABLES MORTGAGE LOANS NOTES REC & UNCONS JV OWNED PORTFOLIO - SHOP 31% 40% 28% 1% SENIORS HOUSING - NNN SKILLED NURSING OTHER/UDP SENIORS HOUSING - SHOP (PROFORMA 2026 ASSUMES $600M IN SHOP INVESTMENTS (MID-POINT) AND $58M IN SHOP CONVERSIONS) 2026 PROFORMA ANNUALIZED NOI BY ASSET TYPE 2026 PROFORMA ANNUALIZED NOI BY INVESTMENT TYPE SNF 46% SNF 36% SNF 22% NNN 54% NNN 39% NNN 32% SHOP 24% SHOP 45% 0% 20% 40% 60% 80% 100% 2024 2025 2026E 4% 1% 1% SH - NNN SH - SHOP SNF OTHER/UDP 1% 1% |
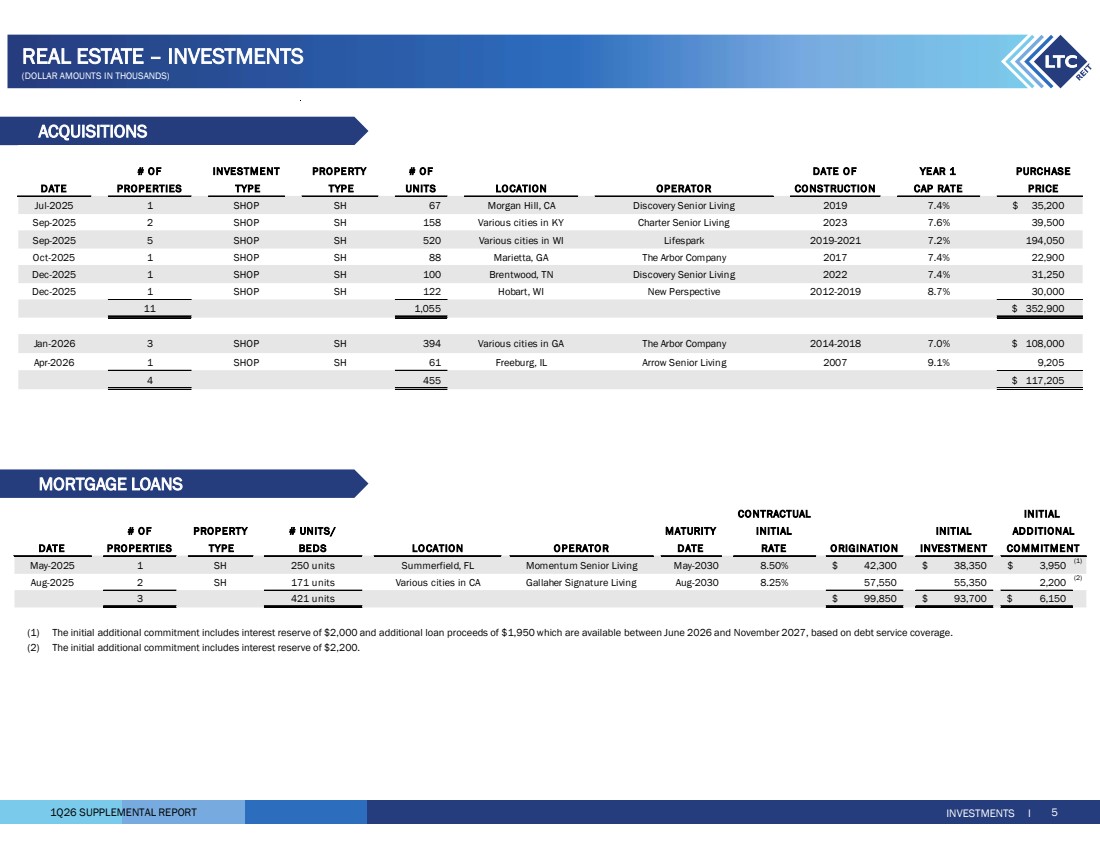
| 1Q26 SUPPLEMENTAL REPORT MORTGAGE LOANS INVESTMENTS I 5 REAL ESTATE – INVESTMENTS (DOLLAR AMOUNTS IN THOUSANDS) ACQUISITIONS # OF INVESTMENT PROPE RTY # OF DATE O F YE AR 1 PROPERTIES TYPE TYPE UNITS LOCATION OPERATO R CO NSTRUCTIO N CAP RATE 1 SHOP SH 67 Morgan Hill, CA Discovery Senior Living 2019 7.4% 35,200 $ 2 SHOP SH 158 Various cities in KY Charter Senior Living 2023 7.6% 39,500 5 SHOP SH 520 Various cities in WI Lifespark 2019-2021 7.2% 194,050 1 SHOP SH 88 Marietta, GA The Arbor Company 2017 7.4% 22,900 1 SHOP SH 100 Brentwood, TN Discovery Senior Living 2022 7.4% 31,250 1 SHOP SH 122 Hobart, WI New Perspective 2012-2019 8.7% 30,000 11 1,055 352,900 $ 3 SHOP SH 394 Various cities in GA The Arbor Company 2014-2018 7.0% 108,000 $ 1 SHOP SH 61 Freeburg, IL Arrow Senior Living 2007 9.1% 9,205 4 455 117,205 $ Apr-2026 Dec-2025 Dec-2025 Jan-2026 Jul-2025 Sep-2025 Oct-2025 Sep-2025 DATE PURCHASE PRICE (1) The initial additional commitment includes interest reserve of $2,000 and additional loan proceeds of $1,950 which are available between June 2026 and November 2027, based on debt service coverage. (2) The initial additional commitment includes interest reserve of $2,200. # OF PROPERTY # UNITS/ MATURITY INITIAL PRO PERTIES TYPE BEDS LO CATION OPERATO R DATE O RIGINATIO N INVESTME NT 1 SH 250 units Summerfield, FL Momentum Senior Living May-2030 8.50% 42,300 $ 38,350 $ 3,950 $ (1) 2 SH 171 units Various cities in CA Gallaher Signature Living Aug-2030 8.25% 57,550 55,350 2,200 (2) 3 421 units 99,850 $ 93,700 $ 6,150 $ Aug-2025 CONTRACTUAL INITIAL COMMITMENT INITIAL ADDITIONAL RATE May-2025 DATE |
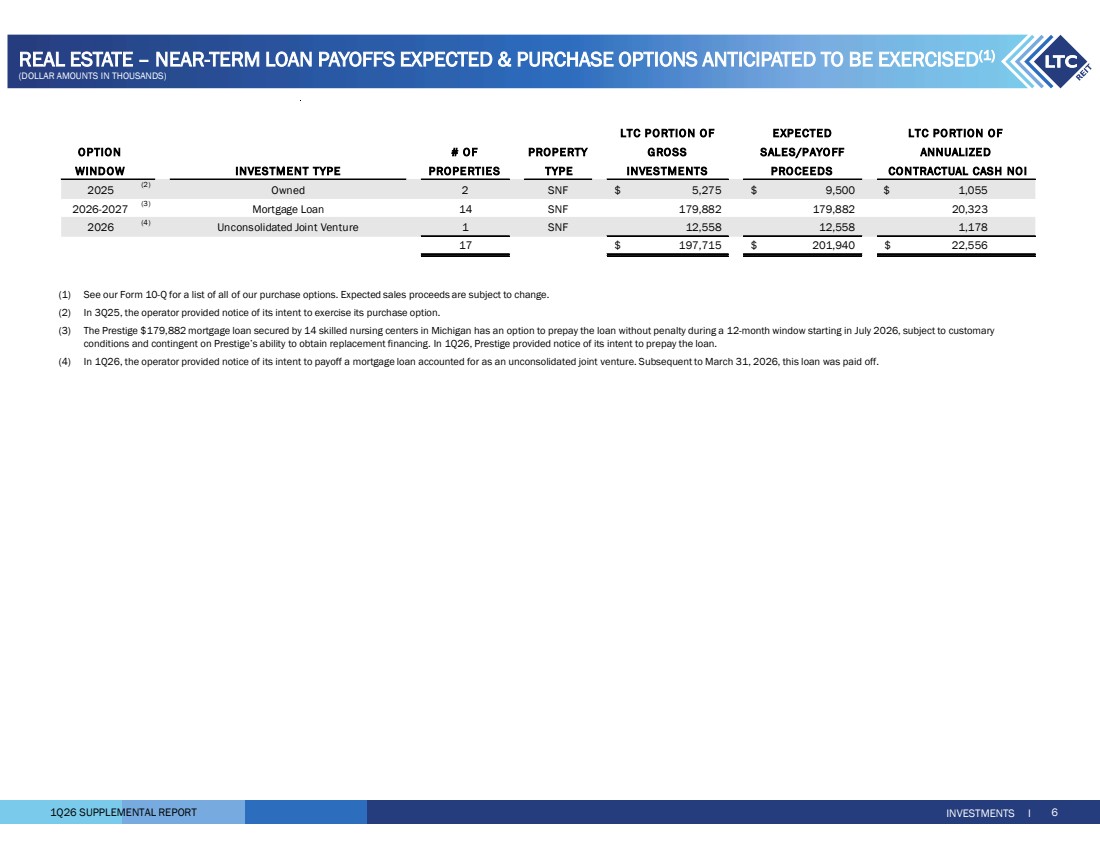
| 1Q26 SUPPLEMENTAL REPORT INVESTMENTS I 6 REAL ESTATE – NEAR-TERM LOAN PAYOFFS EXPECTED & PURCHASE OPTIONS ANTICIPATED TO BE EXERCISED(1) (DOLLAR AMOUNTS IN THOUSANDS) EXPECTED OPTION # OF PROPERTY GROSS SALES/PAYO FF WINDOW INVESTMENT TYPE PROPE RTIES TYPE INVESTME NTS PROCEEDS 2025 (2) Owned 2 SNF 5,275 $ 9,500 $ 1,055 $ 2026-2027 (3) Mortgage Loan 14 SNF 179,882 179,882 20,323 2026 (4) Unconsolidated Joint Venture 1 SNF 12,558 12,558 1,178 17 197,715 $ 201,940 $ 22,556 $ LTC PORTION OF LTC PO RTION OF ANNUALIZED CONTRACTUAL CASH NOI (1) See our Form 10-Q for a list of all of our purchase options. Expected sales proceeds are subject to change. (2) In 3Q25, the operator provided notice of its intent to exercise its purchase option. (3) The Prestige $179,882 mortgage loan secured by 14 skilled nursing centers in Michigan has an option to prepay the loan without penalty during a 12-month window starting in July 2026, subject to customary conditions and contingent on Prestige’s ability to obtain replacement financing. In 1Q26, Prestige provided notice of its intent to prepay the loan. (4) In 1Q26, the operator provided notice of its intent to payoff a mortgage loan accounted for as an unconsolidated joint venture. Subsequent to March 31, 2026, this loan was paid off. |
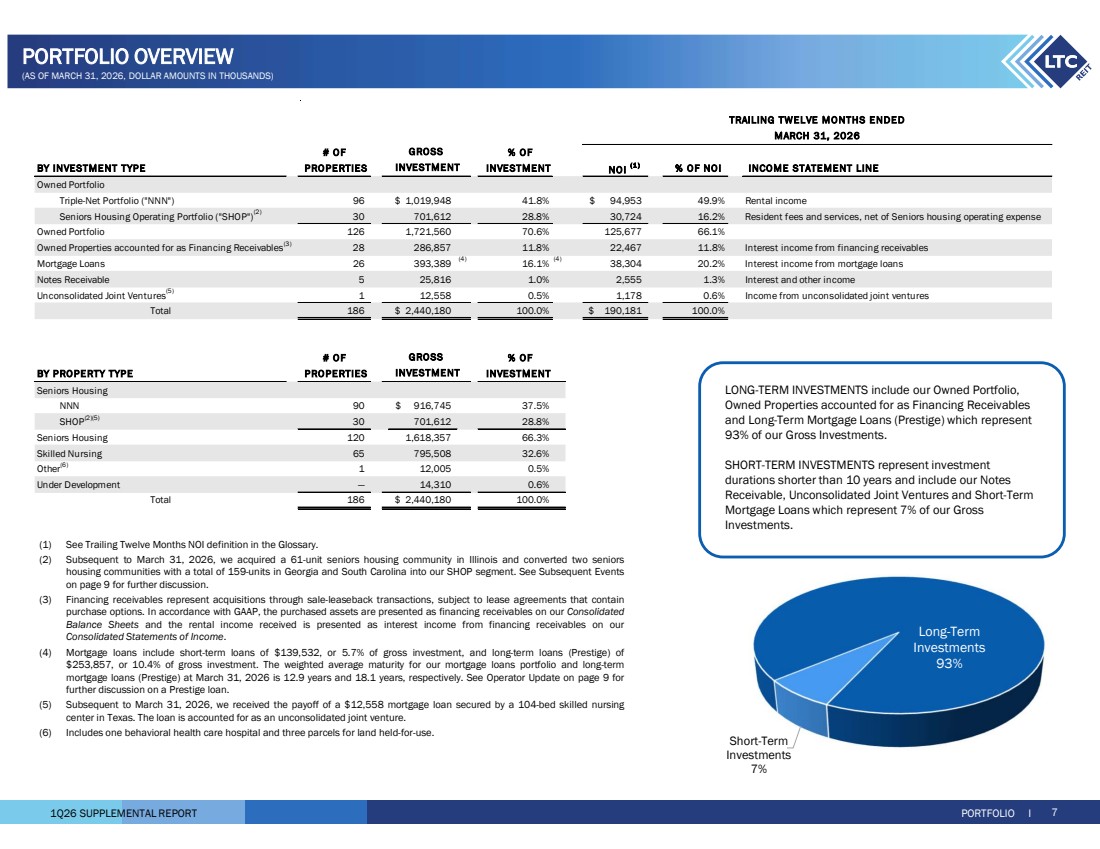
| 1Q26 SUPPLEMENTAL REPORT PORTFOLIO I 7 LONG-TERM INVESTMENTS include our Owned Portfolio, Owned Properties accounted for as Financing Receivables and Long-Term Mortgage Loans (Prestige) which represent 93% of our Gross Investments. SHORT-TERM INVESTMENTS represent investment durations shorter than 10 years and include our Notes Receivable, Unconsolidated Joint Ventures and Short-Term Mortgage Loans which represent 7% of our Gross Investments. Long-Term Investments 93% Short-Term Investments 7% PORTFOLIO OVERVIEW # OF % OF BY INVESTMENT TYPE PROPERTIES INVESTMENT NOI (1 ) % OF NOI INCOME STATEMENT LINE Owned Portfolio Triple-Net Portfolio ("NNN") 96 1,019,948 $ 41.8% 94,953 $ 49.9% Rental income Seniors Housing Operating Portfolio ("SHOP")(2) 701,612 30 28.8% 30,724 16.2% Resident fees and services, net of Seniors housing operating expense Owned Portfolio 126 1,721,560 70.6% 125,677 66.1% Owned Properties accounted for as Financing Receivables(3) 286,857 28 11.8% 22,467 11.8% Interest income from financing receivables Mortgage Loans 26 393,389 (4) 16.1% (4) 20.2% Interest income from mortgage loans 38,304 Notes Receivable 5 25,816 1.0% 2,555 1.3% Interest and other income Unconsolidated Joint Ventures(5) 12,558 1 0.5% 1,178 0.6% Income from unconsolidated joint ventures Total 186 2,440,180 $ 100.0% 190,181 $ 100.0% # OF % OF BY PROPERTY TYPE PROPERTIES INVESTMENT Seniors Housing NNN 90 916,745 $ 37.5% SHOP(2)(5) 701,612 30 28.8% Seniors Housing 120 1,618,357 66.3% Skilled Nursing 65 795,508 32.6% Other(6) 12,005 1 0.5% Under Development — 14,310 0.6% Total 186 2,440,180 $ 100.0% INVESTMENT GROSS INVESTMENT TRAILING TWELVE MONTHS ENDED MARCH 31, 2026 GROSS (1) See Trailing Twelve Months NOI definition in the Glossary. (2) Subsequent to March 31, 2026, we acquired a 61-unit seniors housing community in Illinois and converted two seniors housing communities with a total of 159-units in Georgia and South Carolina into our SHOP segment. See Subsequent Events on page 9 for further discussion. (3) Financing receivables represent acquisitions through sale-leaseback transactions, subject to lease agreements that contain purchase options. In accordance with GAAP, the purchased assets are presented as financing receivables on our Consolidated Balance Sheets and the rental income received is presented as interest income from financing receivables on our Consolidated Statements of Income. (4) Mortgage loans include short-term loans of $139,532, or 5.7% of gross investment, and long-term loans (Prestige) of $253,857, or 10.4% of gross investment. The weighted average maturity for our mortgage loans portfolio and long-term mortgage loans (Prestige) at March 31, 2026 is 12.9 years and 18.1 years, respectively. See Operator Update on page 9 for further discussion on a Prestige loan. (5) Subsequent to March 31, 2026, we received the payoff of a $12,558 mortgage loan secured by a 104-bed skilled nursing center in Texas. The loan is accounted for as an unconsolidated joint venture. (6) Includes one behavioral health care hospital and three parcels for land held-for-use. (AS OF MARCH 31, 2026, DOLLAR AMOUNTS IN THOUSANDS) |
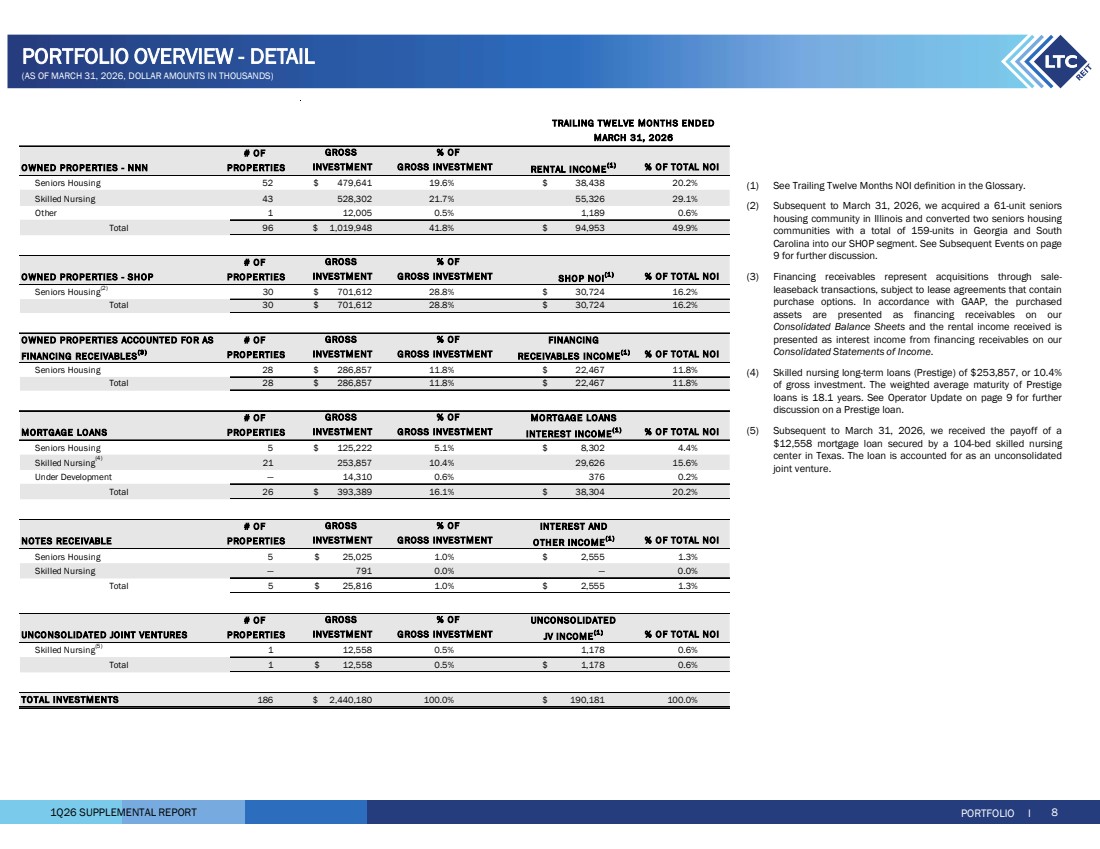
| 1Q26 SUPPLEMENTAL REPORT PORTFOLIO I 8 PORTFOLIO OVERVIEW - DETAIL (AS OF MARCH 31, 2026, DOLLAR AMOUNTS IN THOUSANDS) # OF O WNED PROPERTIES - NNN PRO PERTIES RENTAL INCO ME(1 ) Seniors Housing 52 479,641 $ 19.6% 38,438 $ 20.2% Skilled Nursing 43 528,302 21.7% 55,326 29.1% Other 1 12,005 0.5% 1,189 0.6% Total 96 1,019,948 $ 41.8% 94,953 $ 49.9% # OF O WNED PROPERTIES - SHOP PRO PERTIES SHO P NOI(1 ) Seniors Housing(2) 701,612 30 $ 28.8% 30,724 $ 16.2% Total 30 701,612 $ 28.8% 30,724 $ 16.2% O WNED PROPERTIES ACCO UNTED FO R AS # OF FINANCING FINANCING RECEIVABLES(3 ) PRO PERTIES RECEIVABLES INCOME(1 ) Seniors Housing 28 286,857 $ 11.8% 22,467 $ 11.8% Total 28 286,857 $ 11.8% 22,467 $ 11.8% # OF MO RTGAGE LO ANS MORTGAGE LO ANS PRO PERTIES INTEREST INCOME(1 ) Seniors Housing 5 125,222 $ 5.1% 8,302 $ 4.4% Skilled Nursing(4) 253,857 21 10.4% 29,626 15.6% Under Development — 14,310 0.6% 376 0.2% Total 26 393,389 $ 16.1% 38,304 $ 20.2% # OF INTEREST AND NOTES RECEIVABLE PRO PERTIES O THER INCOME(1 ) Seniors Housing 5 25,025 $ 1.0% 2,555 $ 1.3% Skilled Nursing — 791 0.0% — 0.0% Total 5 25,816 $ 1.0% 2,555 $ 1.3% # OF UNCONSO LIDATED UNCO NSOLIDATED JOINT VENTURES PRO PERTIES JV INCOME(1 ) Skilled Nursing(5) 12,558 1 0.5% 1,178 0.6% Total 1 12,558 $ 0.5% 1,178 $ 0.6% TOTAL INVESTMENTS 2,440,180 186 $ 100.0% 190,181 $ 100.0% GROSS % OF INVESTMENT GROSS INVESTMENT % OF TO TAL NOI GROSS % OF INVESTMENT GROSS INVESTMENT % OF TO TAL NOI INVESTMENT GROSS GROSS INVESTMENT GROSS INVESTMENT % OF GROSS INVESTMENT % OF INVESTMENT TRAILING TWELVE MONTHS ENDED MARCH 31, 2026 GROSS % OF GROSS INVESTMENT % O F TOTAL NOI GROSS INVESTMENT % OF GROSS INVESTMENT % OF TO TAL NOI % O F TO TAL NOI % O F TO TAL NOI (1) See Trailing Twelve Months NOI definition in the Glossary. (2) Subsequent to March 31, 2026, we acquired a 61-unit seniors housing community in Illinois and converted two seniors housing communities with a total of 159-units in Georgia and South Carolina into our SHOP segment. See Subsequent Events on page 9 for further discussion. (3) Financing receivables represent acquisitions through sale-leaseback transactions, subject to lease agreements that contain purchase options. In accordance with GAAP, the purchased assets are presented as financing receivables on our Consolidated Balance Sheets and the rental income received is presented as interest income from financing receivables on our Consolidated Statements of Income. (4) Skilled nursing long-term loans (Prestige) of $253,857, or 10.4% of gross investment. The weighted average maturity of Prestige loans is 18.1 years. See Operator Update on page 9 for further discussion on a Prestige loan. (5) Subsequent to March 31, 2026, we received the payoff of a $12,558 mortgage loan secured by a 104-bed skilled nursing center in Texas. The loan is accounted for as an unconsolidated joint venture. |
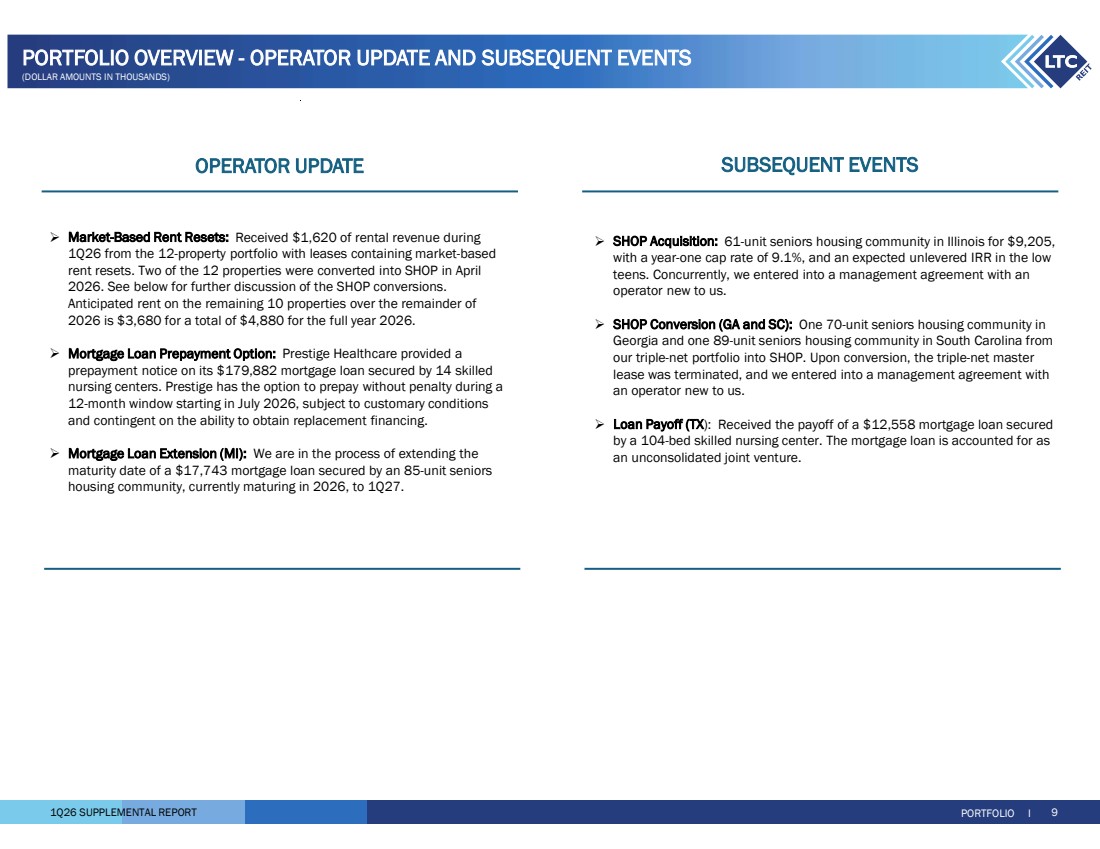
| 1Q26 SUPPLEMENTAL REPORT PORTFOLIO I 9 PORTFOLIO OVERVIEW - OPERATOR UPDATE AND SUBSEQUENT EVENTS (DOLLAR AMOUNTS IN THOUSANDS) Market-Based Rent Resets: Received $1,620 of rental revenue during 1Q26 from the 12-property portfolio with leases containing market-based rent resets. Two of the 12 properties were converted into SHOP in April 2026. See below for further discussion of the SHOP conversions. Anticipated rent on the remaining 10 properties over the remainder of 2026 is $3,680 for a total of $4,880 for the full year 2026. Mortgage Loan Prepayment Option: Prestige Healthcare provided a prepayment notice on its $179,882 mortgage loan secured by 14 skilled nursing centers. Prestige has the option to prepay without penalty during a 12-month window starting in July 2026, subject to customary conditions and contingent on the ability to obtain replacement financing. Mortgage Loan Extension (MI): We are in the process of extending the maturity date of a $17,743 mortgage loan secured by an 85-unit seniors housing community, currently maturing in 2026, to 1Q27. SHOP Acquisition: 61-unit seniors housing community in Illinois for $9,205, with a year-one cap rate of 9.1%, and an expected unlevered IRR in the low teens. Concurrently, we entered into a management agreement with an operator new to us. SHOP Conversion (GA and SC): One 70-unit seniors housing community in Georgia and one 89-unit seniors housing community in South Carolina from our triple-net portfolio into SHOP. Upon conversion, the triple-net master lease was terminated, and we entered into a management agreement with an operator new to us. Loan Payoff (TX): Received the payoff of a $12,558 mortgage loan secured by a 104-bed skilled nursing center. The mortgage loan is accounted for as an unconsolidated joint venture. OPERATOR UPDATE SUBSEQUENT EVENTS |
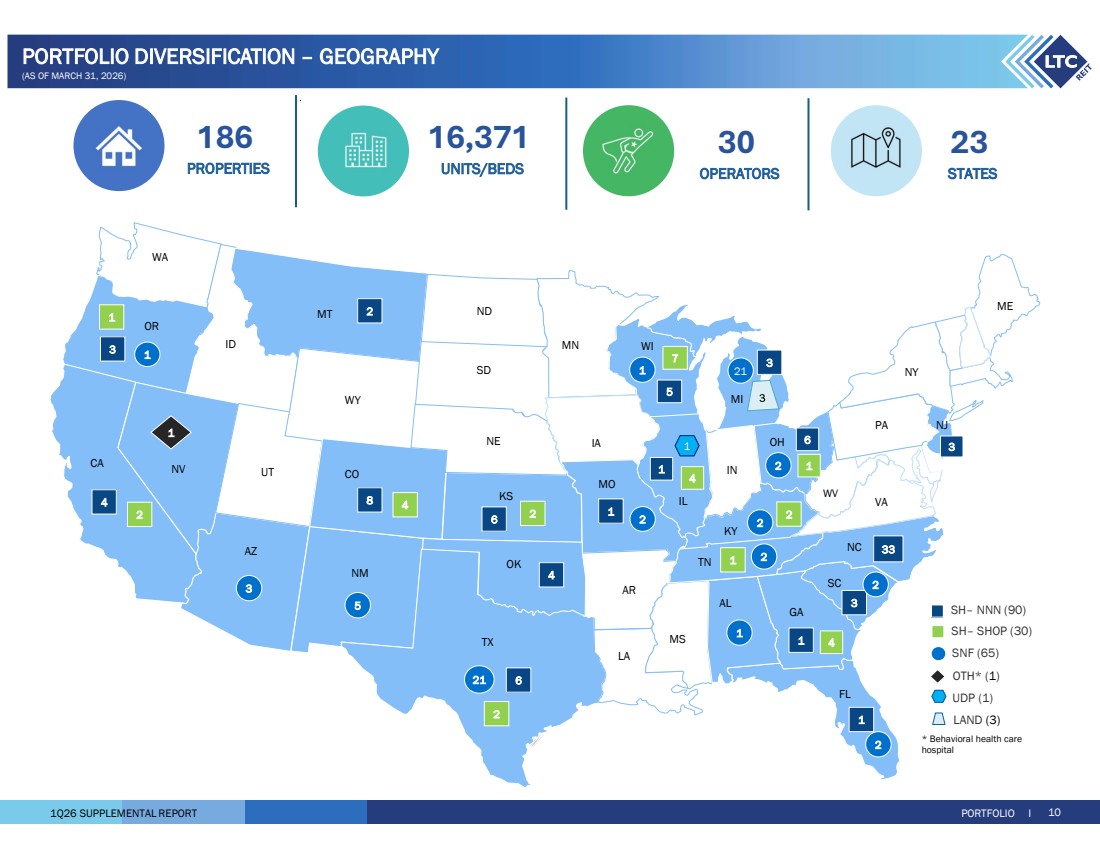
| 1Q26 SUPPLEMENTAL REPORT PORTFOLIO I 10 PORTFOLIO DIVERSIFICATION – GEOGRAPHY * Behavioral health care hospital SNF (65) SH– NNN (90) OTH* (1) LAND (3) UDP (1) CA WA ME NV WY IL AR WV ND NY OR AZ NM TX UT ID MT SD NE KS OK MS MN WI FL AL GA SC TN MO IA IN OH PA NJ NC VA CO KY 2 21 1 3 1 2 2 1 4 4 6 33 1 6 6 8 5 3 21 2 1 5 1 2 3 LA 1 2 3 MI 2 1 1 3 SH– SHOP (30) 4 2 2 4 7 1 2 4 1 1 OPERATORS 30 STATES 23 PROPERTIES 186 UNITS/BEDS 16,371 (AS OF MARCH 31, 2026) 2 |
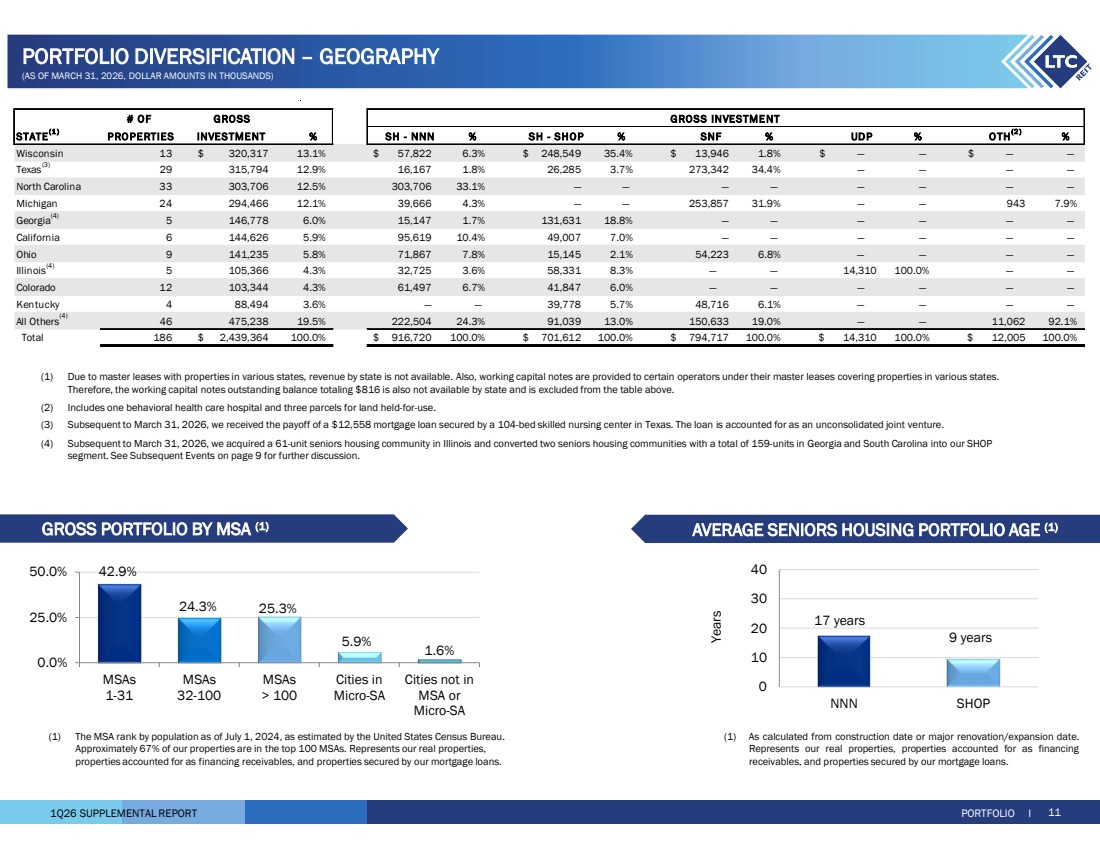
| 1Q26 SUPPLEMENTAL REPORT GROSS PORTFOLIO BY MSA (1) AVERAGE SENIORS HOUSING PORTFOLIO AGE (1) PORTFOLIO I 11 PORTFOLIO DIVERSIFICATION – GEOGRAPHY (AS OF MARCH 31, 2026, DOLLAR AMOUNTS IN THOUSANDS) 42.9% 24.3% 25.3% 5.9% 1.6% 0.0% 25.0% 50.0% MSAs 1-31 MSAs 32-100 MSAs > 100 Cities in Micro-SA Cities not in MSA or Micro-SA 17 years 9 years 0 10 20 30 40 NNN SHOP Years (1) The MSA rank by population as of July 1, 2024, as estimated by the United States Census Bureau. Approximately 67% of our properties are in the top 100 MSAs. Represents our real properties, properties accounted for as financing receivables, and properties secured by our mortgage loans. (1) As calculated from construction date or major renovation/expansion date. Represents our real properties, properties accounted for as financing receivables, and properties secured by our mortgage loans. (1) Due to master leases with properties in various states, revenue by state is not available. Also, working capital notes are provided to certain operators under their master leases covering properties in various states. Therefore, the working capital notes outstanding balance totaling $816 is also not available by state and is excluded from the table above. (2) Includes one behavioral health care hospital and three parcels for land held-for-use. (3) Subsequent to March 31, 2026, we received the payoff of a $12,558 mortgage loan secured by a 104-bed skilled nursing center in Texas. The loan is accounted for as an unconsolidated joint venture. (4) Subsequent to March 31, 2026, we acquired a 61-unit seniors housing community in Illinois and converted two seniors housing communities with a total of 159-units in Georgia and South Carolina into our SHOP segment. See Subsequent Events on page 9 for further discussion. # OF STATE(1 ) PRO PERTIES % SH - NNN % SH - SHOP % SNF % UDP % % Wisconsin 13 320,317 $ 13.1% 57,822 $ 6.3% 248,549 $ 35.4% 13,946 $ 1.8% — $ — — $ — Texas(3) 315,794 29 12.9% 16,167 1.8% 26,285 3.7% 273,342 34.4% — — — — North Carolina 33 303,706 12.5% 303,706 33.1% — — — — — — — — Michigan 24 294,466 12.1% 39,666 4.3% — — 253,857 31.9% — — 943 7.9% Georgia(4) 146,778 5 6.0% 15,147 1.7% 131,631 18.8% — — — — — — California 6 144,626 5.9% 95,619 10.4% 49,007 7.0% — — — — — — Ohio 9 141,235 5.8% 71,867 7.8% 15,145 2.1% 54,223 6.8% — — — — Illinois(4) 105,366 5 4.3% 32,725 3.6% 58,331 8.3% — — 14,310 100.0% — — Colorado 12 103,344 4.3% 61,497 6.7% 41,847 6.0% — — — — — — Kentucky 4 88,494 3.6% — — 39,778 5.7% 48,716 6.1% — — — — All Others(4) 475,238 46 19.5% 222,504 24.3% 91,039 13.0% 150,633 19.0% — — 11,062 92.1% Total 186 2,439,364 $ 100.0% 916,720 $ 100.0% 701,612 $ 100.0% 794,717 $ 100.0% 14,310 $ 100.0% 12,005 $ 100.0% O TH(2 ) INVESTMENT GROSS GROSS INVESTME NT |
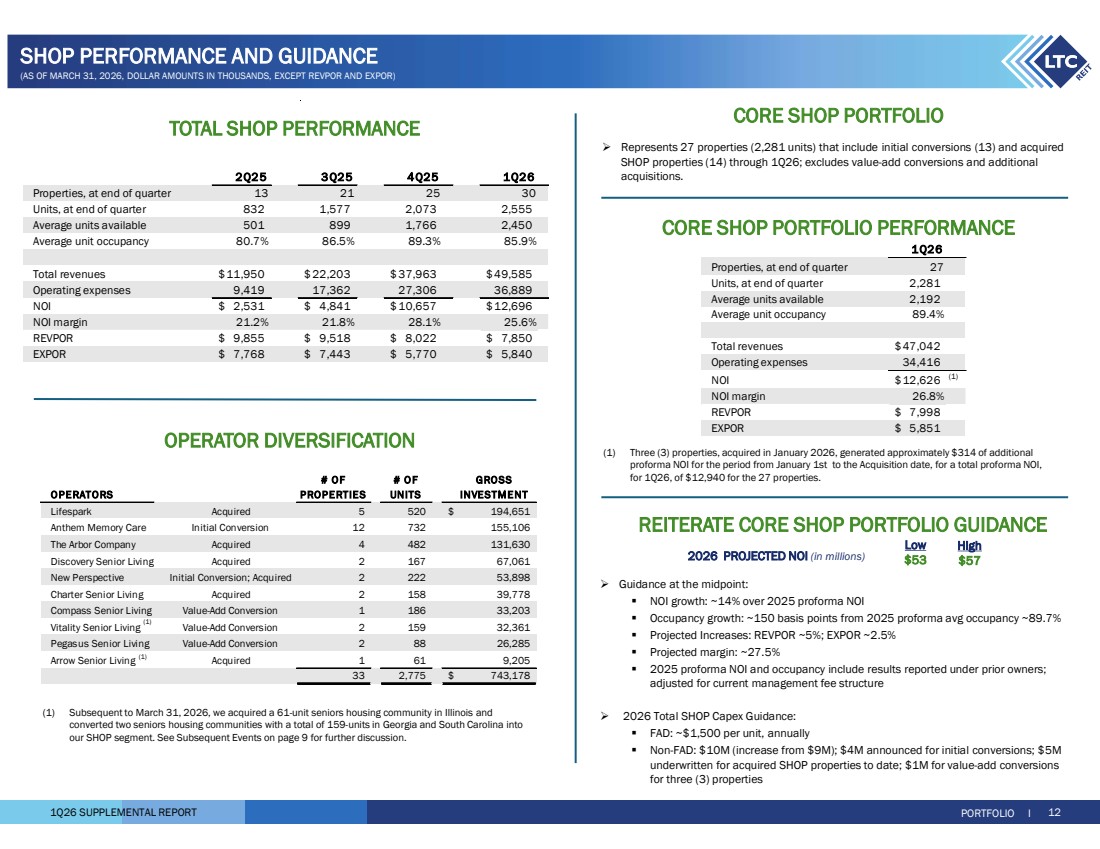
| 1Q26 SUPPLEMENTAL REPORT 1Q26 Properties, at end of quarter 27 Units, at end of quarter 2,281 Average units available 2,192 Average unit occupancy 89.4% Total revenues 47,042 $ Operating expenses 34,416 NOI 12,626 $ (1) NOI margin 26.8% REVPOR 7,998 $ EXPOR 5,851 $ PORTFOLIO I 12 SHOP PERFORMANCE AND GUIDANCE TOTAL SHOP PERFORMANCE 2Q25 3Q25 4Q25 1Q26 Properties, at end of quarter 13 21 25 30 Units, at end of quarter 832 1,577 2,073 2,555 Average units available 501 899 1,766 2,450 Average unit occupancy 80.7% 86.5% 89.3% 85.9% Total revenues 11,950 $ 22,203 $ 37,963 $ 49,585 $ Operating expenses 9,419 17,362 27,306 36,889 NOI 2,531 $ 4,841 $ 10,657 $ 12,696 $ NOI margin 21.2% 21.8% 28.1% 25.6% REVPOR 9,855 $ 9,518 $ 8,022 $ 7,850 $ EXPOR 7,768 $ 7,443 $ 5,770 $ 5,840 $ (AS OF MARCH 31, 2026, DOLLAR AMOUNTS IN THOUSANDS, EXCEPT REVPOR AND EXPOR) OPERATOR DIVERSIFICATION (1) Subsequent to March 31, 2026, we acquired a 61-unit seniors housing community in Illinois and converted two seniors housing communities with a total of 159-units in Georgia and South Carolina into our SHOP segment. See Subsequent Events on page 9 for further discussion. # OF # O F GROSS OPERATORS PROPERTIES UNITS INVESTMENT Lifespark Acquired 5 520 194,651 $ Anthem Memory Care Initial Conversion 12 732 155,106 The Arbor Company Acquired 4 482 131,630 Discovery Senior Living Acquired 2 167 67,061 New Perspective Initial Conversion; Acquired 2 222 53,898 Charter Senior Living Acquired 2 158 39,778 Compass Senior Living Value-Add Conversion 1 186 33,203 Vitality Senior Living Value-Add Conversion 2 159 32,361 Pegasus Senior Living Value-Add Conversion 2 88 26,285 Arrow Senior Living Acquired 1 61 9,205 2,775 33 743,178 $ (1) (1) CORE SHOP PORTFOLIO Guidance at the midpoint: NOI growth: ~14% over 2025 proforma NOI Occupancy growth: ~150 basis points from 2025 proforma avg occupancy ~89.7% Projected Increases: REVPOR ~5%; EXPOR ~2.5% Projected margin: ~27.5% 2025 proforma NOI and occupancy include results reported under prior owners; adjusted for current management fee structure 2026 Total SHOP Capex Guidance: FAD: ~$1,500 per unit, annually Non-FAD: $10M (increase from $9M); $4M announced for initial conversions; $5M underwritten for acquired SHOP properties to date; $1M for value-add conversions for three (3) properties Low $53 High $57 2026 PROJECTED NOI (in millions) REITERATE CORE SHOP PORTFOLIO GUIDANCE Represents 27 properties (2,281 units) that include initial conversions (13) and acquired SHOP properties (14) through 1Q26; excludes value-add conversions and additional acquisitions. CORE SHOP PORTFOLIO PERFORMANCE (1) Three (3) properties, acquired in January 2026, generated approximately $314 of additional proforma NOI for the period from January 1st to the Acquisition date, for a total proforma NOI, for 1Q26, of $12,940 for the 27 properties. |
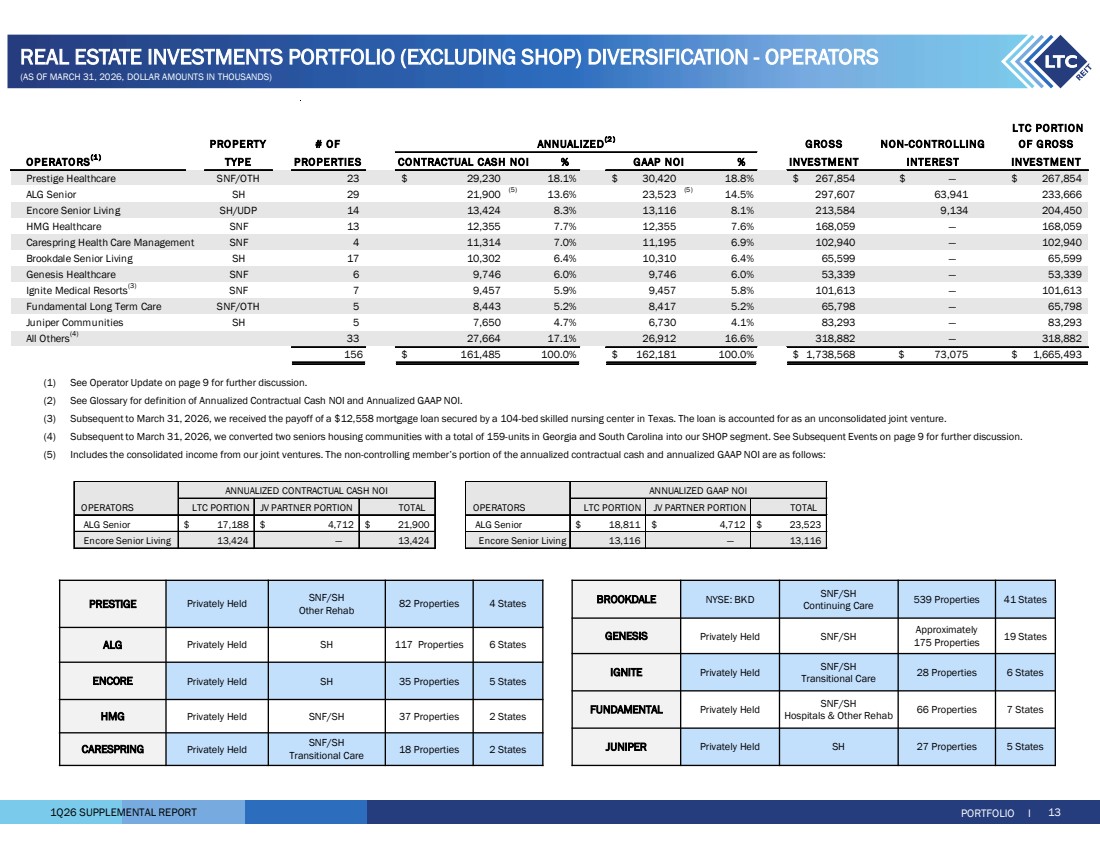
| 1Q26 SUPPLEMENTAL REPORT PORTFOLIO I 13 REAL ESTATE INVESTMENTS PORTFOLIO (EXCLUDING SHOP) DIVERSIFICATION - OPERATORS LTC PORTION PRO PERTY # OF GRO SS OF GROSS OPERATO RS(1 ) TYPE PROPERTIES CONTRACTUAL CASH NOI % % INVESTMENT INVESTMENT Prestige Healthcare SNF/OTH 23 29,230 $ 18.1% 30,420 $ 18.8% 267,854 $ — $ 267,854 $ ALG Senior SH 29 21,900 (5) 13.6% 23,523 (5) 14.5% 297,607 63,941 233,666 Encore Senior Living SH/UDP 14 13,424 8.3% 13,116 8.1% 213,584 9,134 204,450 HMG Healthcare SNF 13 12,355 7.7% 12,355 7.6% 168,059 — 168,059 Carespring Health Care Management SNF 4 11,314 7.0% 11,195 6.9% 102,940 — 102,940 Brookdale Senior Living SH 17 10,302 6.4% 10,310 6.4% 65,599 — 65,599 Genesis Healthcare SNF 6 9,746 6.0% 9,746 6.0% 53,339 — 53,339 Ignite Medical Resorts(3) SNF 7 9,457 5.9% 9,457 5.8% 101,613 — 101,613 Fundamental Long Term Care SNF/OTH 5 8,443 5.2% 8,417 5.2% 65,798 — 65,798 Juniper Communities SH 5 7,650 4.7% 6,730 4.1% 83,293 — 83,293 All Others(4) 27,664 33 17.1% 26,912 16.6% 318,882 — 318,882 156 161,485 $ 100.0% 162,181 $ 100.0% 1,738,568 $ 73,075 $ 1,665,493 $ ANNUALIZED(2 ) NON-CONTRO LLING GAAP NOI INTEREST (1) See Operator Update on page 9 for further discussion. (2) See Glossary for definition of Annualized Contractual Cash NOI and Annualized GAAP NOI. (3) Subsequent to March 31, 2026, we received the payoff of a $12,558 mortgage loan secured by a 104-bed skilled nursing center in Texas. The loan is accounted for as an unconsolidated joint venture. (4) Subsequent to March 31, 2026, we converted two seniors housing communities with a total of 159-units in Georgia and South Carolina into our SHOP segment. See Subsequent Events on page 9 for further discussion. (5) Includes the consolidated income from our joint ventures. The non-controlling member’s portion of the annualized contractual cash and annualized GAAP NOI are as follows: OPERATORS LTC PORTION JV PARTNER PORTION TOTAL OPERATORS LTC PORTION JV PARTNER PORTION TOTAL ALG Senior 17,188 $ 4,712 $ 21,900 $ ALG Senior 18,811 $ 4,712 $ 23,523 $ Encore Senior Living 13,424 — 13,424 Encore Senior Living 13,116 — 13,116 ANNUALIZED CONTRACTUAL CASH NOI ANNUALIZED GAAP NOI 539 Properties 41 States SNF/SH Continuing Care BROOKDALE NYSE: BKD 19 States Approximately 175 Properties GENESIS Privately Held SNF/SH 28 Properties 6 States SNF/SH Transitional Care IGNITE Privately Held 66 Properties 7 States SNF/SH Hospitals & Other Rehab FUNDAMENTAL Privately Held JUNIPER Privately Held SH 27 Properties 5 States 82 Properties 4 States SNF/SH Other Rehab PRESTIGE Privately Held ALG Privately Held SH 117 Properties 6 States ENCORE Privately Held SH 35 Properties 5 States HMG Privately Held SNF/SH 37 Properties 2 States 18 Properties 2 States SNF/SH Transitional Care CARESPRING Privately Held (AS OF MARCH 31, 2026, DOLLAR AMOUNTS IN THOUSANDS) |
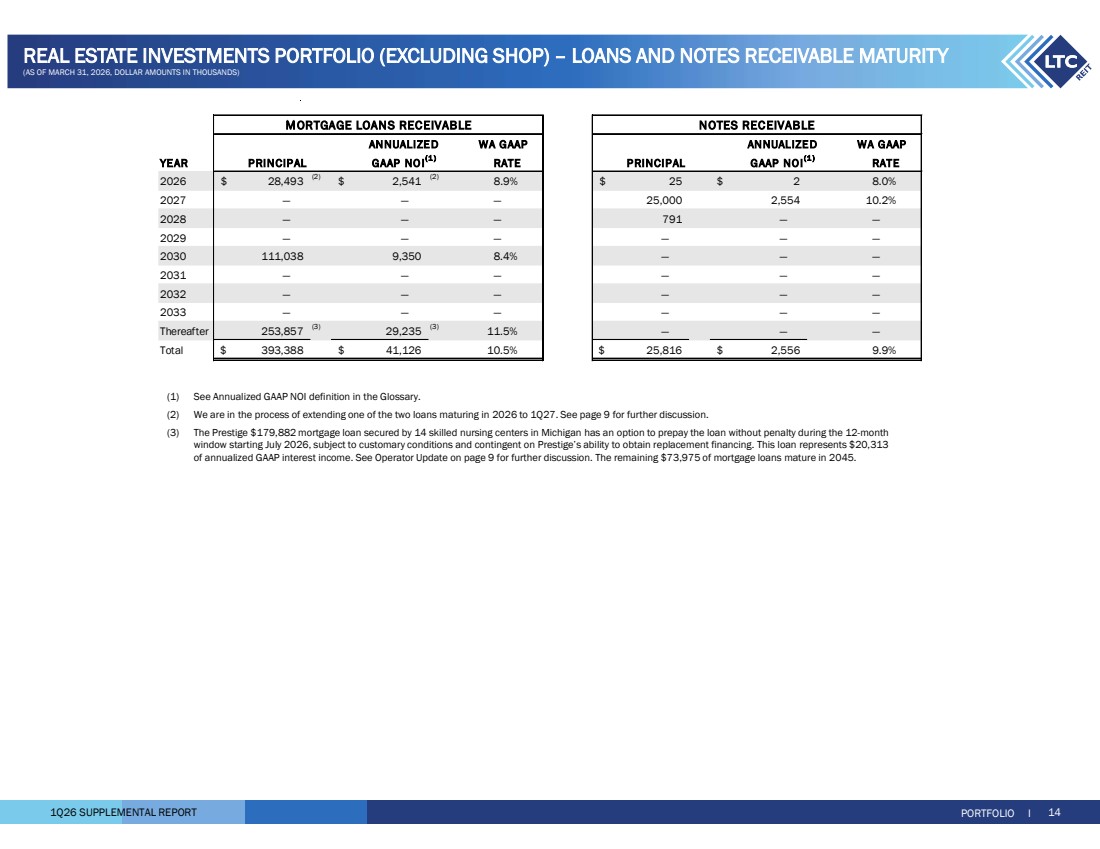
| 1Q26 SUPPLEMENTAL REPORT REAL ESTATE INVESTMENTS PORTFOLIO (EXCLUDING SHOP) – LOANS AND NOTES RECEIVABLE MATURITY (AS OF MARCH 31, 2026, DOLLAR AMOUNTS IN THOUSANDS) PORTFOLIO I 14 (1) See Annualized GAAP NOI definition in the Glossary. (2) We are in the process of extending one of the two loans maturing in 2026 to 1Q27. See page 9 for further discussion. (3) The Prestige $179,882 mortgage loan secured by 14 skilled nursing centers in Michigan has an option to prepay the loan without penalty during the 12-month window starting July 2026, subject to customary conditions and contingent on Prestige’s ability to obtain replacement financing. This loan represents $20,313 of annualized GAAP interest income. See Operator Update on page 9 for further discussion. The remaining $73,975 of mortgage loans mature in 2045. YEAR PRINCIPAL PRINCIPAL 2026 28,493 $ (2) $ 2,541 (2) 8.9% 25 $ 2 $ 8.0% 2027 — — — 25,000 2,554 10.2% 2028 — — — 791 — — 2029 — — — — — — 2030 111,038 9,350 8.4% — — — 2031 — — — — — — 2032 — — — — — — 2033 — — — — — — Thereafter 253,857 (3) 29,235 (3) 11.5% — — — Total 393,388 $ 41,126 $ 10.5% 25,816 $ 2,556 $ 9.9% MORTGAGE LOANS RECEIVABLE NOTES RECEIVABLE GAAP NO I(1 ) ANNUALIZED WA GAAP RATE ANNUALIZED WA GAAP GAAP NOI(1 ) RATE |
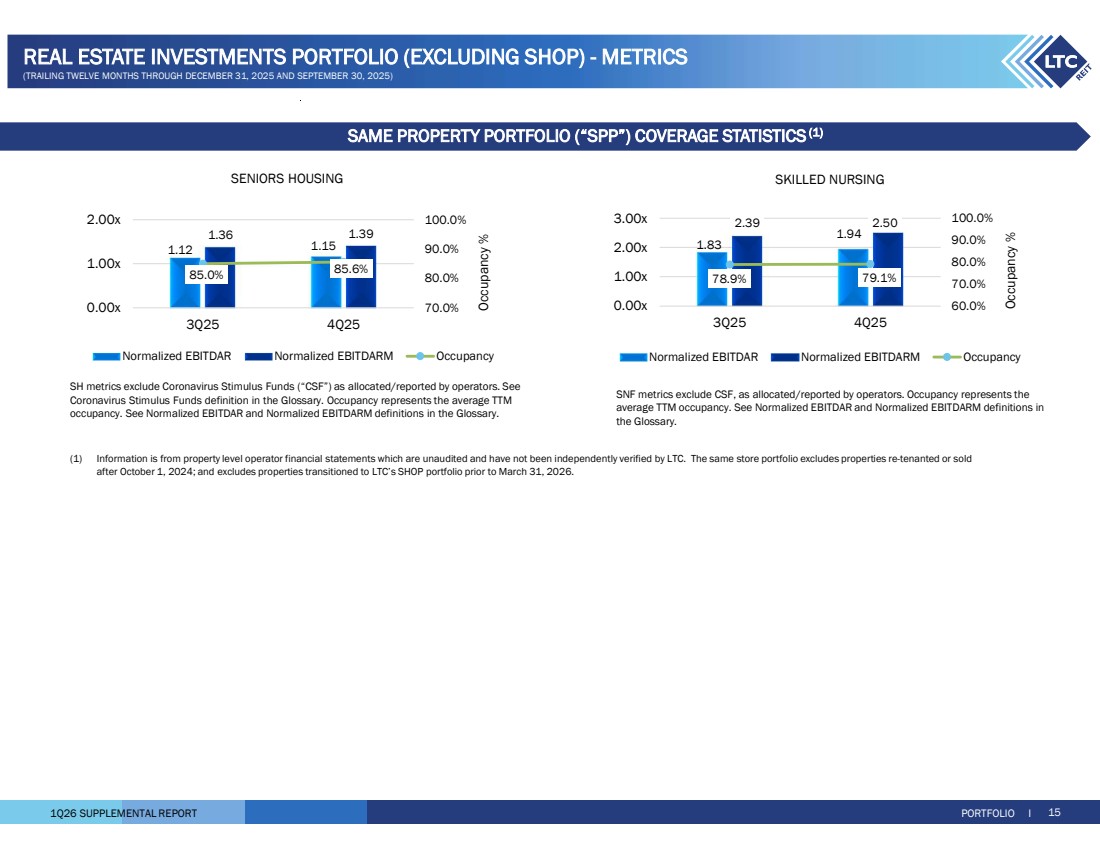
| 1Q26 SUPPLEMENTAL REPORT (1) Information is from property level operator financial statements which are unaudited and have not been independently verified by LTC. The same store portfolio excludes properties re-tenanted or sold after October 1, 2024; and excludes properties transitioned to LTC’s SHOP portfolio prior to March 31, 2026. SENIORS HOUSING SKILLED NURSING 1.83 1.94 2.39 2.50 78.9% 79.1% 60.0% 70.0% 80.0% 90.0% 100.0% 0.00x 1.00x 2.00x 3.00x 3Q25 4Q25 Occupancy % Normalized EBITDAR Normalized EBITDARM Occupancy 1.12 1.15 1.36 1.39 85.0% 85.6% 70.0% 80.0% 90.0% 100.0% 0.00x 1.00x 2.00x 3Q25 4Q25 Occupancy % Normalized EBITDAR Normalized EBITDARM Occupancy SNF metrics exclude CSF, as allocated/reported by operators. Occupancy represents the average TTM occupancy. See Normalized EBITDAR and Normalized EBITDARM definitions in the Glossary. SH metrics exclude Coronavirus Stimulus Funds (“CSF”) as allocated/reported by operators. See Coronavirus Stimulus Funds definition in the Glossary. Occupancy represents the average TTM occupancy. See Normalized EBITDAR and Normalized EBITDARM definitions in the Glossary. PORTFOLIO I 15 REAL ESTATE INVESTMENTS PORTFOLIO (EXCLUDING SHOP) - METRICS (TRAILING TWELVE MONTHS THROUGH DECEMBER 31, 2025 AND SEPTEMBER 30, 2025) SAME PROPERTY PORTFOLIO (“SPP”) COVERAGE STATISTICS(1) |
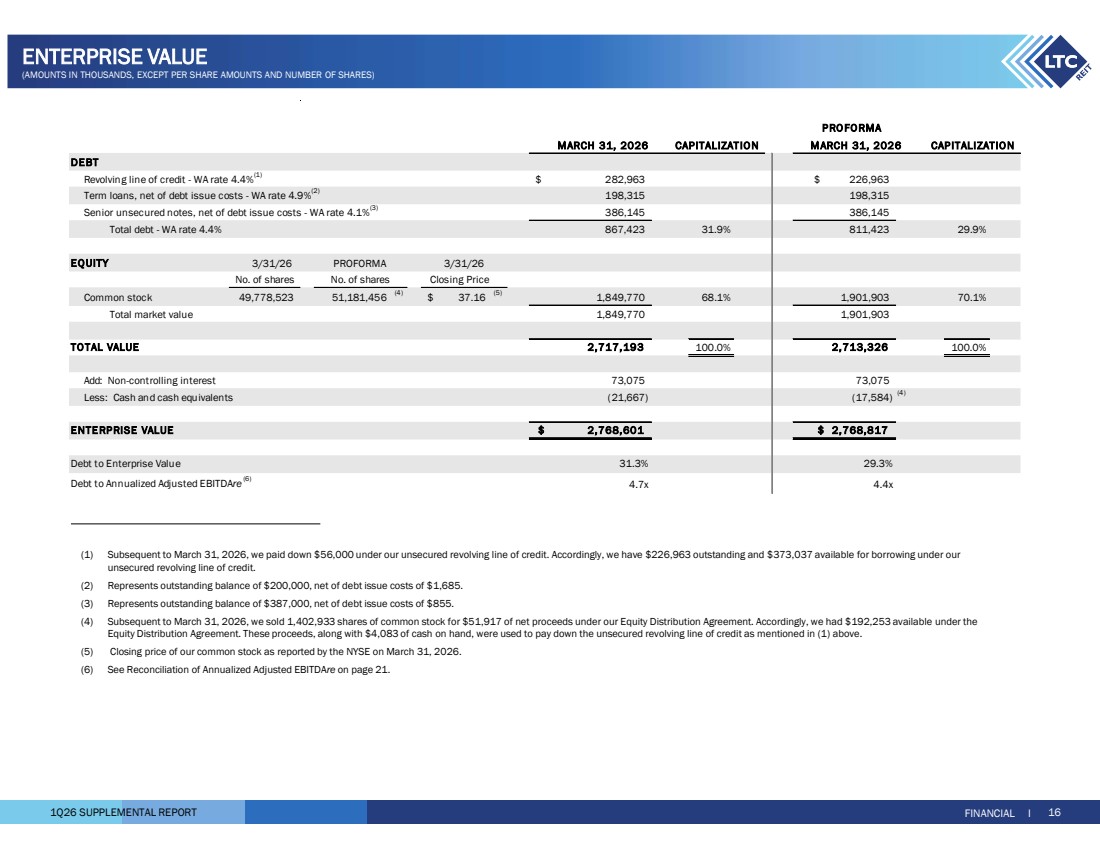
| 1Q26 SUPPLEMENTAL REPORT FINANCIAL I 16 ENTERPRISE VALUE (AMOUNTS IN THOUSANDS, EXCEPT PER SHARE AMOUNTS AND NUMBER OF SHARES) PRO FORMA MARCH 31, 2026 Revolving line of credit - WA rate 4.4%(1) $ 226,963 282,963 $ Term loans, net of debt issue costs - WA rate 4.9%(2) 198,315 198,315 Senior unsecured notes, net of debt issue costs - WA rate 4.1%(3) 386,145 386,145 Total debt - WA rate 4.4% 867,423 31.9% 811,423 29.9% No. of shares Closing Price Common stock 49,778,523 51,181,456 (4) $ 37.16 (5) 68.1% 1,901,903 1,849,770 70.1% Total market value 1,849,770 1,901,903 2,717,193 100.0% 2,713,326 100.0% Add: Non-controlling interest 73,075 73,075 Less: Cash and cash equivalents (21,667) (17,584) (4) $ 2,768,817 2,768,601 $ Debt to Enterprise Value 31.3% 29.3% Debt to Annualized Adjusted EBITDAre (6) 4.7x 4.4x PROFORMA No. of shares 3/31/26 CAPITALIZATION MARCH 31, 2026 CAPITALIZATION DEBT EQUITY 3/31/26 TOTAL VALUE ENTE RPRISE VALUE (1) Subsequent to March 31, 2026, we paid down $56,000 under our unsecured revolving line of credit. Accordingly, we have $226,963 outstanding and $373,037 available for borrowing under our unsecured revolving line of credit. (2) Represents outstanding balance of $200,000, net of debt issue costs of $1,685. (3) Represents outstanding balance of $387,000, net of debt issue costs of $855. (4) Subsequent to March 31, 2026, we sold 1,402,933 shares of common stock for $51,917 of net proceeds under our Equity Distribution Agreement. Accordingly, we had $192,253 available under the Equity Distribution Agreement. These proceeds, along with $4,083 of cash on hand, were used to pay down the unsecured revolving line of credit as mentioned in (1) above. (5) Closing price of our common stock as reported by the NYSE on March 31, 2026. (6) See Reconciliation of Annualized Adjusted EBITDAre on page 21. |
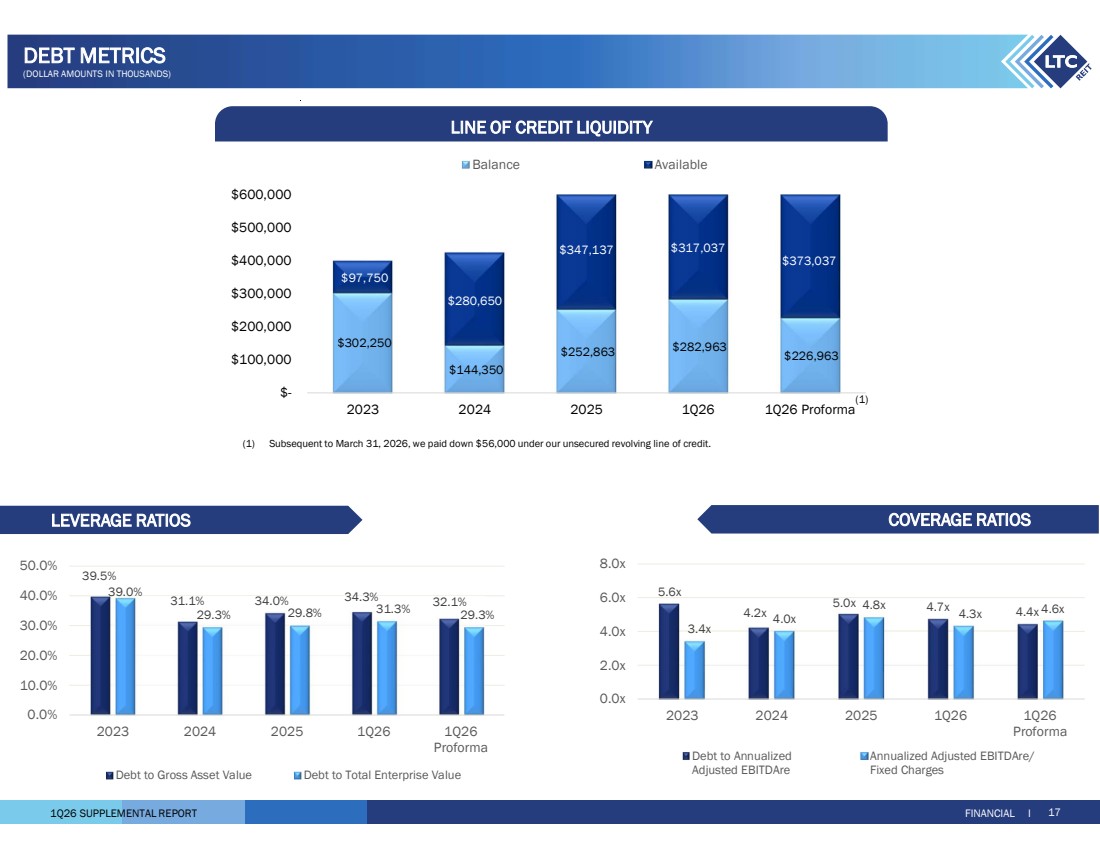
| 1Q26 SUPPLEMENTAL REPORT FINANCIAL I 17 DEBT METRICS (DOLLAR AMOUNTS IN THOUSANDS) $302,250 $144,350 $252,863 $282,963 $226,963 $97,750 $280,650 $347,137 $317,037 $373,037 $- $100,000 $200,000 $300,000 $400,000 $500,000 $600,000 2023 2024 2025 1Q26 1Q26 Proforma Balance Available (1) LEVERAGE RATIOS COVERAGE RATIOS LINE OF CREDIT LIQUIDITY 39.5% 31.1% 34.0% 34.3% 32.1% 39.0% 29.3% 29.8% 31.3% 29.3% 0.0% 10.0% 20.0% 30.0% 40.0% 50.0% 2023 2024 2025 1Q26 1Q26 Proforma Debt to Gross Asset Value Debt to Total Enterprise Value 5.6x 4.2x 5.0x 4.7x 4.4x 3.4x 4.0x 4.8x 4.3x 4.6x 0.0x 2.0x 4.0x 6.0x 8.0x 2023 2024 2025 1Q26 1Q26 Proforma Debt to Annualized Adjusted EBITDAre Annualized Adjusted EBITDAre/ Fixed Charges (1) Subsequent to March 31, 2026, we paid down $56,000 under our unsecured revolving line of credit. |
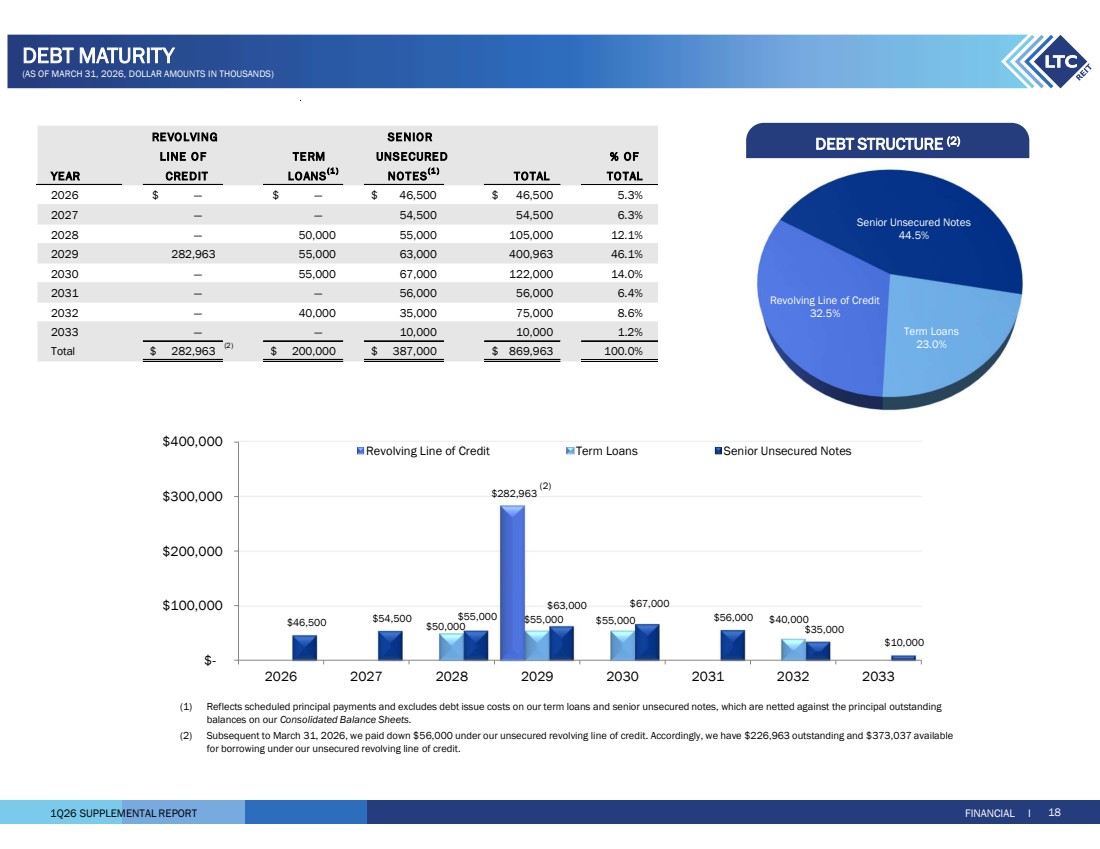
| 1Q26 SUPPLEMENTAL REPORT FINANCIAL I 18 DEBT MATURITY (AS OF MARCH 31, 2026, DOLLAR AMOUNTS IN THOUSANDS) REVOLVING SENIOR LINE OF TERM UNSECURED % OF YEAR CREDIT LOANS(1 ) NOTES(1 ) TOTAL TO TAL 2026 — $ — $ 46,500 $ 46,500 $ 5.3% 2027 — — 54,500 54,500 6.3% 2028 — 50,000 55,000 105,000 12.1% 2029 282,963 55,000 63,000 400,963 46.1% 2030 — 55,000 67,000 122,000 14.0% 2031 — — 56,000 56,000 6.4% 2032 — 40,000 35,000 75,000 8.6% 2033 — — 10,000 10,000 1.2% Total 282,963 $ (2) $ 387,000 200,000 $ 869,963 $ 100.0% Senior Unsecured Notes 44.5% Term Loans 23.0% Revolving Line of Credit 32.5% (1) Reflects scheduled principal payments and excludes debt issue costs on our term loans and senior unsecured notes, which are netted against the principal outstanding balances on our Consolidated Balance Sheets. (2) Subsequent to March 31, 2026, we paid down $56,000 under our unsecured revolving line of credit. Accordingly, we have $226,963 outstanding and $373,037 available for borrowing under our unsecured revolving line of credit. DEBT STRUCTURE (2) $282,963 $50,000 $55,000 $55,000 $40,000 $46,500 $54,500 $55,000 $63,000 $67,000 $56,000 $35,000 $10,000 $- $100,000 $200,000 $300,000 $400,000 2026 2027 2028 2029 2030 2031 2032 2033 Revolving Line of Credit Term Loans Senior Unsecured Notes (2) |
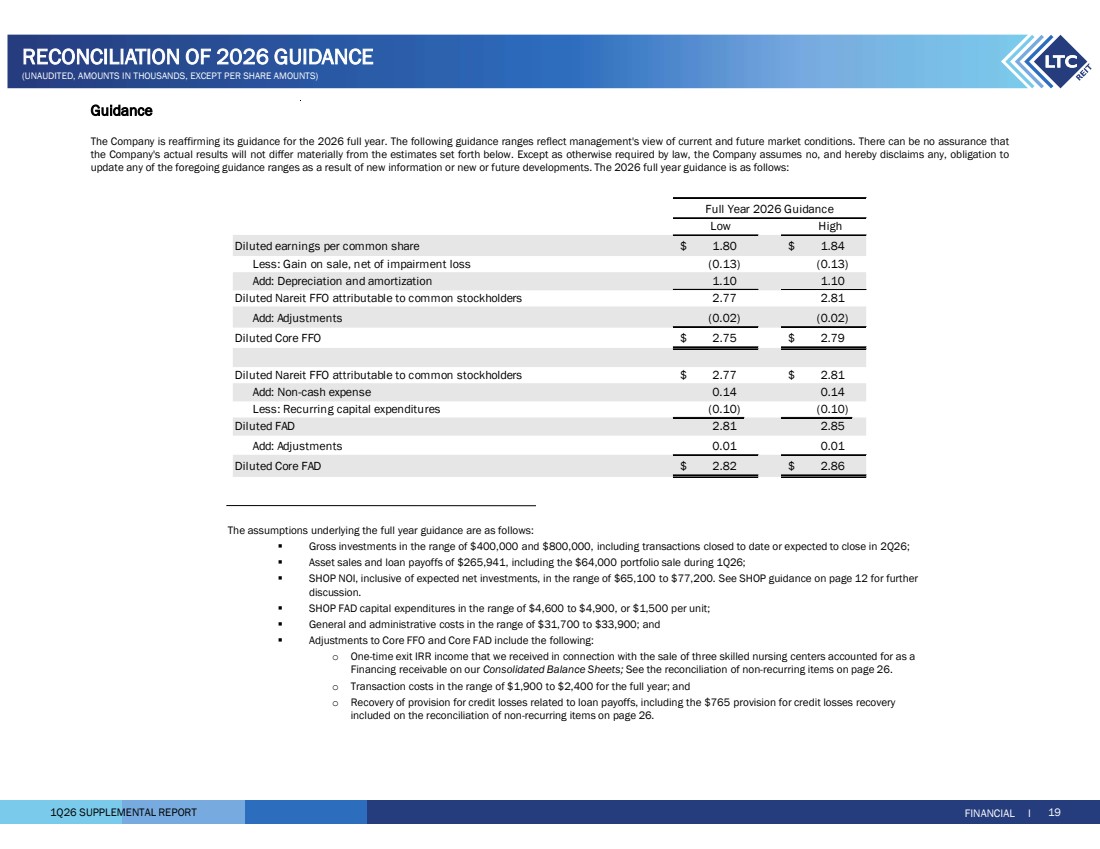
| 1Q26 SUPPLEMENTAL REPORT FINANCIAL I 19 RECONCILIATION OF 2026 GUIDANCE (UNAUDITED, AMOUNTS IN THOUSANDS, EXCEPT PER SHARE AMOUNTS) Guidance The Company is reaffirming its guidance for the 2026 full year. The following guidance ranges reflect management's view of current and future market conditions. There can be no assurance that the Company's actual results will not differ materially from the estimates set forth below. Except as otherwise required by law, the Company assumes no, and hereby disclaims any, obligation to update any of the foregoing guidance ranges as a result of new information or new or future developments. The 2026 full year guidance is as follows: The assumptions underlying the full year guidance are as follows: Gross investments in the range of $400,000 and $800,000, including transactions closed to date or expected to close in 2Q26; Asset sales and loan payoffs of $265,941, including the $64,000 portfolio sale during 1Q26; SHOP NOI, inclusive of expected net investments, in the range of $65,100 to $77,200. See SHOP guidance on page 12 for further discussion. SHOP FAD capital expenditures in the range of $4,600 to $4,900, or $1,500 per unit; General and administrative costs in the range of $31,700 to $33,900; and Adjustments to Core FFO and Core FAD include the following: o One-time exit IRR income that we received in connection with the sale of three skilled nursing centers accounted for as a Financing receivable on our Consolidated Balance Sheets; See the reconciliation of non-recurring items on page 26. o Transaction costs in the range of $1,900 to $2,400 for the full year; and o Recovery of provision for credit losses related to loan payoffs, including the $765 provision for credit losses recovery included on the reconciliation of non-recurring items on page 26. Low High Diluted earnings per common share 1.80 $ 1.84 $ Less: Gain on sale, net of impairment loss (0.13) (0.13) Add: Depreciation and amortization 1.10 1.10 Diluted Nareit FFO attributable to common stockholders 2.77 2.81 Add: Adjustments (0.02) (0.02) Diluted Core FFO 2.75 $ 2.79 $ Diluted Nareit FFO attributable to common stockholders 2.77 $ 2.81 $ Add: Non-cash expense 0.14 0.14 Less: Recurring capital expenditures (0.10) (0.10) Diluted FAD 2.81 2.85 Add: Adjustments 0.01 0.01 Diluted Core FAD 2.82 $ 2.86 $ Full Year 2026 Guidance |
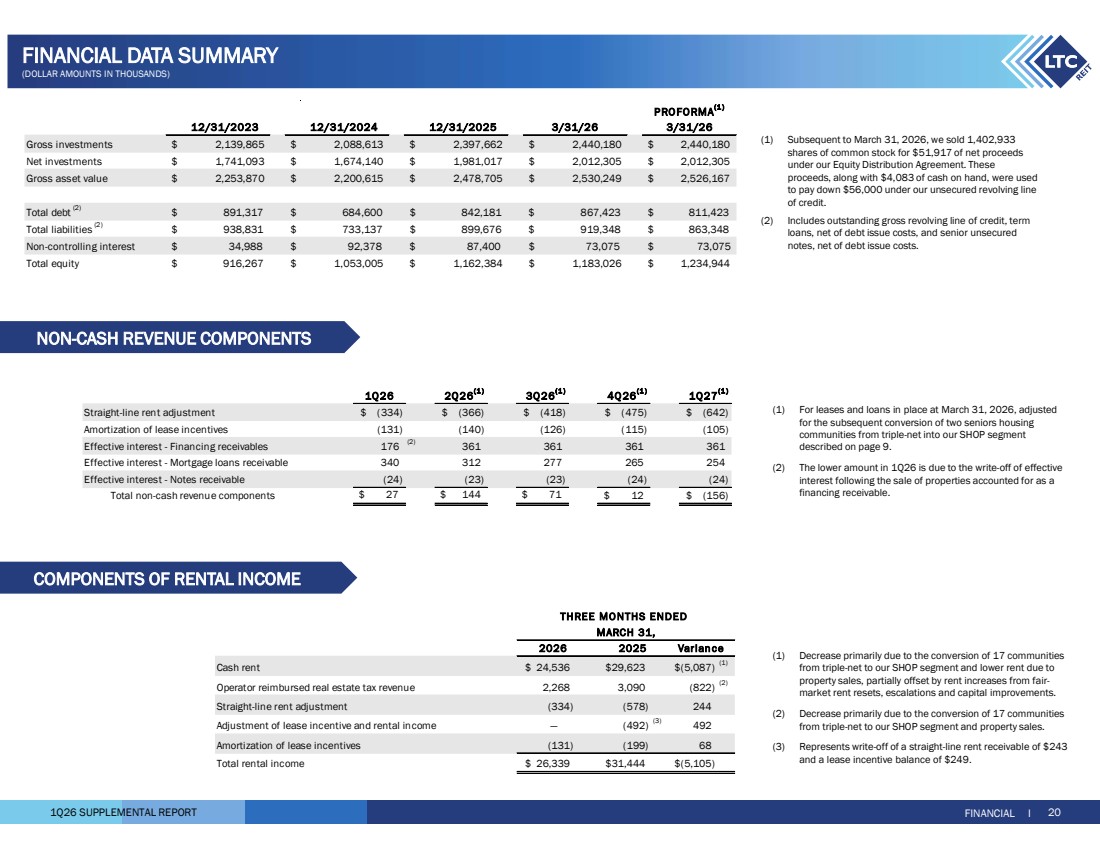
| 1Q26 SUPPLEMENTAL REPORT (1) For leases and loans in place at March 31, 2026, adjusted for the subsequent conversion of two seniors housing communities from triple-net into our SHOP segment described on page 9. (2) The lower amount in 1Q26 is due to the write-off of effective interest following the sale of properties accounted for as a financing receivable. (1) Decrease primarily due to the conversion of 17 communities from triple-net to our SHOP segment and lower rent due to property sales, partially offset by rent increases from fair-market rent resets, escalations and capital improvements. (2) Decrease primarily due to the conversion of 17 communities from triple-net to our SHOP segment and property sales. (3) Represents write-off of a straight-line rent receivable of $243 and a lease incentive balance of $249. COMPONENTS OF RENTAL INCOME FINANCIAL I 20 FINANCIAL DATA SUMMARY (DOLLAR AMOUNTS IN THOUSANDS) 12/31/2023 12/31/2024 12/31/2025 3/31/26 PROFORMA(1 ) 3/31/26 Gross investments $ 2,139,865 $ 2,088,613 $ 2,397,662 $ 2,440,180 $ 2,440,180 Net investments $ 1,741,093 $ 1,674,140 $ 1,981,017 $ 2,012,305 $ 2,012,305 Gross asset value $ 2,253,870 $ 2,200,615 $ 2,478,705 $ 2,530,249 $ 2,526,167 Total debt (2) $ 891,317 $ 684,600 $ 842,181 $ 867,423 $ 811,423 Total liabilities (2) $ 938,831 $ 733,137 $ 899,676 $ 919,348 $ 863,348 Non-controlling interest $ 34,988 $ 92,378 $ 87,400 $ 73,075 $ 73,075 Total equity $ 916,267 $ 1,053,005 $ 1,162,384 $ 1,183,026 $ 1,234,944 Cash rent 24,536 $ 29,623 $ (5,087) $ (1) Operator reimbursed real estate tax revenue 2,268 3,090 (822) (2) Straight-line rent adjustment (334) (578) 244 Adjustment of lease incentive and rental income — (492) (3) 492 Amortization of lease incentives (131) (199) 68 Total rental income 26,339 $ 31,444 $ (5,105) $ 2026 2025 Varian ce THREE MONTHS ENDED MARCH 31, (1) Subsequent to March 31, 2026, we sold 1,402,933 shares of common stock for $51,917 of net proceeds under our Equity Distribution Agreement. These proceeds, along with $4,083 of cash on hand, were used to pay down $56,000 under our unsecured revolving line of credit. (2) Includes outstanding gross revolving line of credit, term loans, net of debt issue costs, and senior unsecured notes, net of debt issue costs. NON-CASH REVENUE COMPONENTS 1Q26 2Q26(1 ) 3Q26(1 ) 4Q 26(1 ) 1Q27(1 ) $ (366) (334) $ (418) $ (475) $ (642) $ Amortization of lease incentives (131) (140) (126) (115) (105) Effective interest - Financing receivables 176 (2) 361 361 361 361 Effective interest - Mortgage loans receivable 340 312 277 265 254 Effective interest - Notes receivable (24) (23) (23) (24) (24) $ 27 $ 144 $ 71 $ (156) 12 $ Straight-line rent adjustment Total non-cash revenue components |
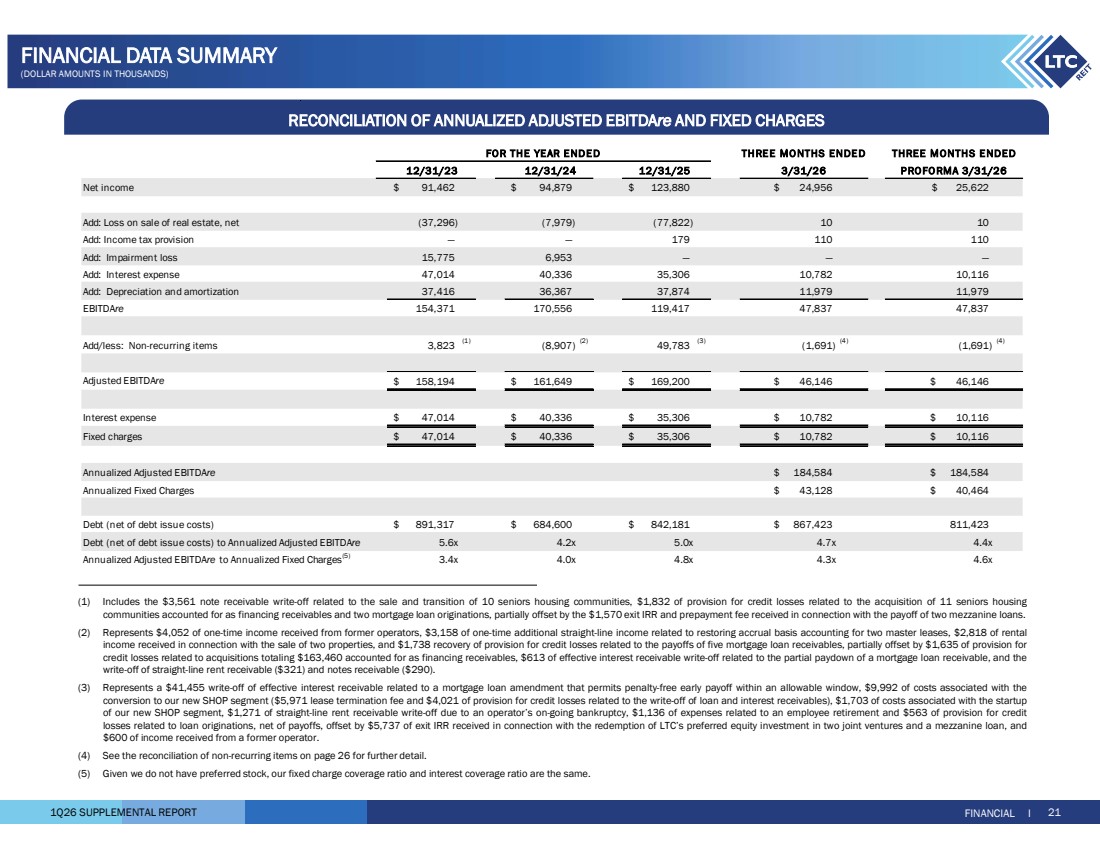
| 1Q26 SUPPLEMENTAL REPORT RECONCILIATION OF ANNUALIZED ADJUSTED EBITDAre AND FIXED CHARGES FINANCIAL I 21 FINANCIAL DATA SUMMARY (DOLLAR AMOUNTS IN THOUSANDS) 12/31/25 Net income 91,462 $ 94,879 $ 123,880 $ 24,956 $ 25,622 $ Add: Loss on sale of real estate, net (37,296) (7,979) (77,822) 10 10 Add: Income tax provision — — 179 110 110 Add: Impairment loss 15,775 6,953 — — — Add: Interest expense 47,014 40,336 35,306 10,782 10,116 Add: Depreciation and amortization 37,416 36,367 37,874 11,979 11,979 EBITDAre 170,556 154,371 119,417 47,837 47,837 Add/less: Non-recurring items 3,823 (1) (8,907) (2) 49,783 (3) (1,691) (4) (1,691) (4) Adjusted EBITDAre $ 161,649 158,194 $ 169,200 $ 46,146 $ 46,146 $ Interest expense 47,014 $ 40,336 $ 35,306 $ 10,782 $ 10,116 $ Fixed charges 47,014 $ 40,336 $ 35,306 $ 10,782 $ 10,116 $ Annualized Adjusted EBITDAre $ 184,584 184,584 $ Annualized Fixed Charges 43,128 $ 40,464 $ Debt (net of debt issue costs) 891,317 $ 684,600 $ 842,181 $ 867,423 $ 811,423 Debt (net of debt issue costs) to Annualized Adjusted EBITDAre 5.6x 4.2x 5.0x 4.7x 4.4x Annualized Adjusted EBITDAre to Annualized Fixed Charges(5) 3.4x 4.0x 4.8x 4.3x 4.6x FOR THE YEAR ENDED THRE E MO NTHS ENDE D THREE MONTHS E NDED 12/31/23 12/31/24 3/31/26 PROFO RMA 3/31/26 (1) Includes the $3,561 note receivable write-off related to the sale and transition of 10 seniors housing communities, $1,832 of provision for credit losses related to the acquisition of 11 seniors housing communities accounted for as financing receivables and two mortgage loan originations, partially offset by the $1,570 exit IRR and prepayment fee received in connection with the payoff of two mezzanine loans. (2) Represents $4,052 of one-time income received from former operators, $3,158 of one-time additional straight-line income related to restoring accrual basis accounting for two master leases, $2,818 of rental income received in connection with the sale of two properties, and $1,738 recovery of provision for credit losses related to the payoffs of five mortgage loan receivables, partially offset by $1,635 of provision for credit losses related to acquisitions totaling $163,460 accounted for as financing receivables, $613 of effective interest receivable write-off related to the partial paydown of a mortgage loan receivable, and the write-off of straight-line rent receivable ($321) and notes receivable ($290). (3) Represents a $41,455 write-off of effective interest receivable related to a mortgage loan amendment that permits penalty-free early payoff within an allowable window, $9,992 of costs associated with the conversion to our new SHOP segment ($5,971 lease termination fee and $4,021 of provision for credit losses related to the write-off of loan and interest receivables), $1,703 of costs associated with the startup of our new SHOP segment, $1,271 of straight-line rent receivable write-off due to an operator’s on-going bankruptcy, $1,136 of expenses related to an employee retirement and $563 of provision for credit losses related to loan originations, net of payoffs, offset by $5,737 of exit IRR received in connection with the redemption of LTC’s preferred equity investment in two joint ventures and a mezzanine loan, and $600 of income received from a former operator. (4) See the reconciliation of non-recurring items on page 26 for further detail. (5) Given we do not have preferred stock, our fixed charge coverage ratio and interest coverage ratio are the same. |
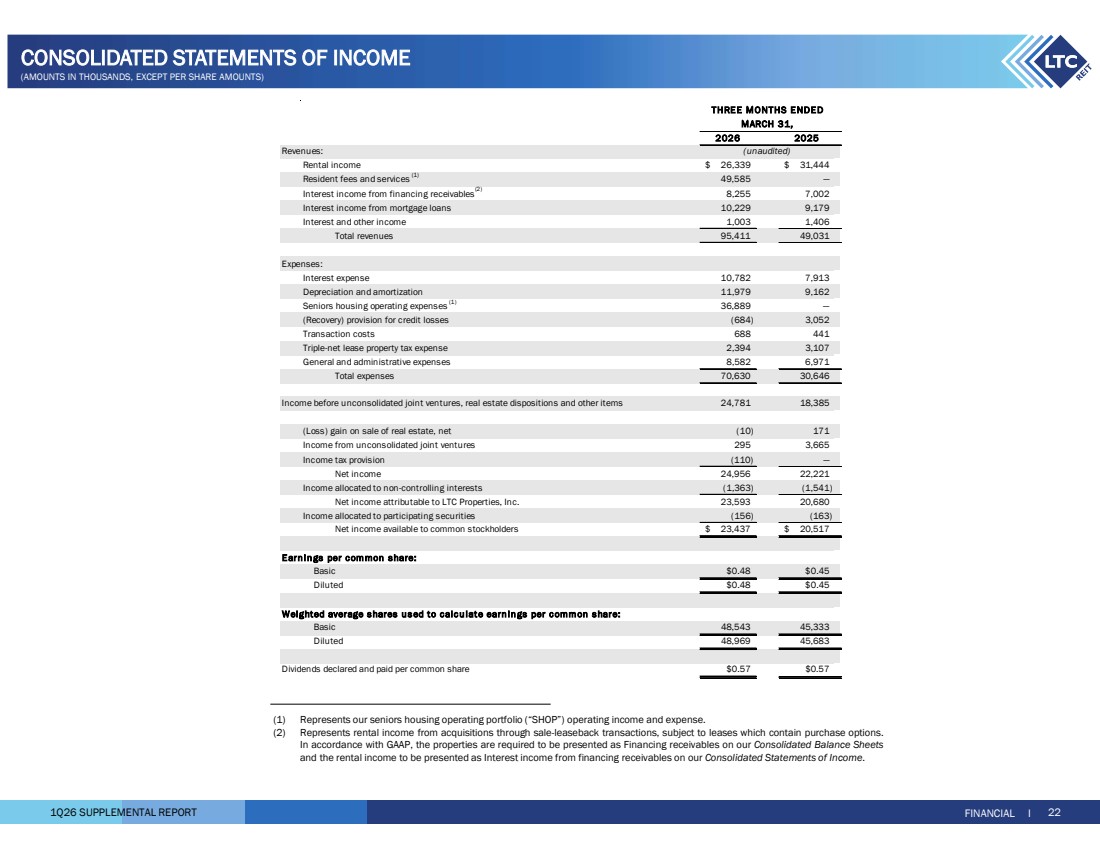
| 1Q26 SUPPLEMENTAL REPORT 2026 2025 Revenues: Rental income 26,339 $ 31,444 $ Resident fees and services (1) 49,585 — Interest income from financing receivables(2) 8,255 7,002 Interest income from mortgage loans 10,229 9,179 Interest and other income 1,003 1,406 Total revenues 95,411 49,031 Expenses: Interest expense 10,782 7,913 Depreciation and amortization 11,979 9,162 Seniors housing operating expenses (1) — 36,889 (Recovery) provision for credit losses (684) 3,052 Transaction costs 688 441 Triple-net lease property tax expense 2,394 3,107 General and administrative expenses 8,582 6,971 Total expenses 70,630 30,646 24,781 18,385 (Loss) gain on sale of real estate, net (10) 171 Income from unconsolidated joint ventures 295 3,665 Income tax provision (110) — Net income 24,956 22,221 Income allocated to non-controlling interests (1,363) (1,541) Net income attributable to LTC Properties, Inc. 23,593 20,680 Income allocated to participating securities (156) (163) Net income available to common stockholders 23,437 $ 20,517 $ E arnin gs per common share: Basic $0.48 $0.45 Diluted $0.48 $0.45 Weighted average shares u s ed to calc u late earn in gs per c ommon share: Basic 48,543 45,333 Diluted 48,969 45,683 Dividends declared and paid per common share $0.57 $0.57 Income before unconsolidated joint ventures, real estate dispositions and other items THRE E MONTHS E NDED MARCH 31, (unaudited) FINANCIAL I 22 CONSOLIDATED STATEMENTS OF INCOME (AMOUNTS IN THOUSANDS, EXCEPT PER SHARE AMOUNTS) (1) Represents our seniors housing operating portfolio (“SHOP”) operating income and expense. (2) Represents rental income from acquisitions through sale-leaseback transactions, subject to leases which contain purchase options. In accordance with GAAP, the properties are required to be presented as Financing receivables on our Consolidated Balance Sheets and the rental income to be presented as Interest income from financing receivables on our Consolidated Statements of Income. |
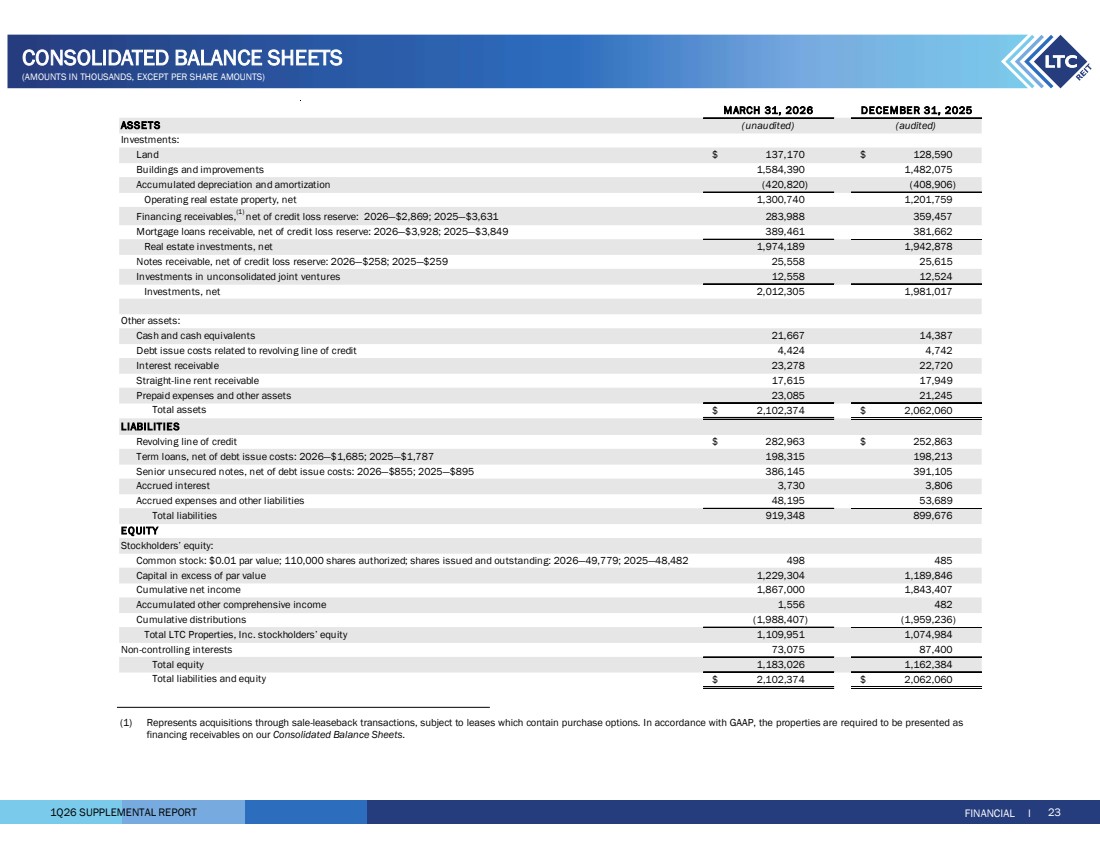
| 1Q26 SUPPLEMENTAL REPORT FINANCIAL I 23 CONSOLIDATED BALANCE SHEETS (AMOUNTS IN THOUSANDS, EXCEPT PER SHARE AMOUNTS) ASSETS Investments: Land $ 137,170 $ 128,590 Buildings and improvements 1,584,390 1,482,075 Accumulated depreciation and amortization (420,820) (408,906) Operating real estate property, net 1,300,740 1,201,759 Financing receivables,(1) net of credit loss reserve: 2026—$2,869; 2025—$3,631 283,988 359,457 Mortgage loans receivable, net of credit loss reserve: 2026—$3,928; 2025—$3,849 389,461 381,662 Real estate investments, net 1,974,189 1,942,878 Notes receivable, net of credit loss reserve: 2026—$258; 2025—$259 25,558 25,615 Investments in unconsolidated joint ventures 12,558 12,524 Investments, net 2,012,305 1,981,017 Other assets: Cash and cash equivalents 21,667 14,387 Debt issue costs related to revolving line of credit 4,424 4,742 Interest receivable 23,278 22,720 Straight-line rent receivable 17,615 17,949 Prepaid expenses and other assets 23,085 21,245 Total assets $ 2,102,374 $ 2,062,060 LIABILITIES Revolving line of credit $ 282,963 $ 252,863 Term loans, net of debt issue costs: 2026—$1,685; 2025—$1,787 198,315 198,213 Senior unsecured notes, net of debt issue costs: 2026—$855; 2025—$895 386,145 391,105 Accrued interest 3,730 3,806 Accrued expenses and other liabilities 48,195 53,689 Total liabilities 919,348 899,676 EQUITY Stockholders’ equity: Common stock: $0.01 par value; 110,000 shares authorized; shares issued and outstanding: 2026—49,779; 2025—48,482 498 485 Capital in excess of par value 1,229,304 1,189,846 Cumulative net income 1,867,000 1,843,407 Accumulated other comprehensive income 1,556 482 Cumulative distributions (1,988,407) (1,959,236) Total LTC Properties, Inc. stockholders’ equity 1,109,951 1,074,984 Non-controlling interests 73,075 87,400 Total equity 1,183,026 1,162,384 Total liabilities and equity $ 2,102,374 $ 2,062,060 (unaudited) (audited) MARCH 31, 2026 DECEMBER 31, 2025 (1) Represents acquisitions through sale-leaseback transactions, subject to leases which contain purchase options. In accordance with GAAP, the properties are required to be presented as financing receivables on our Consolidated Balance Sheets. |
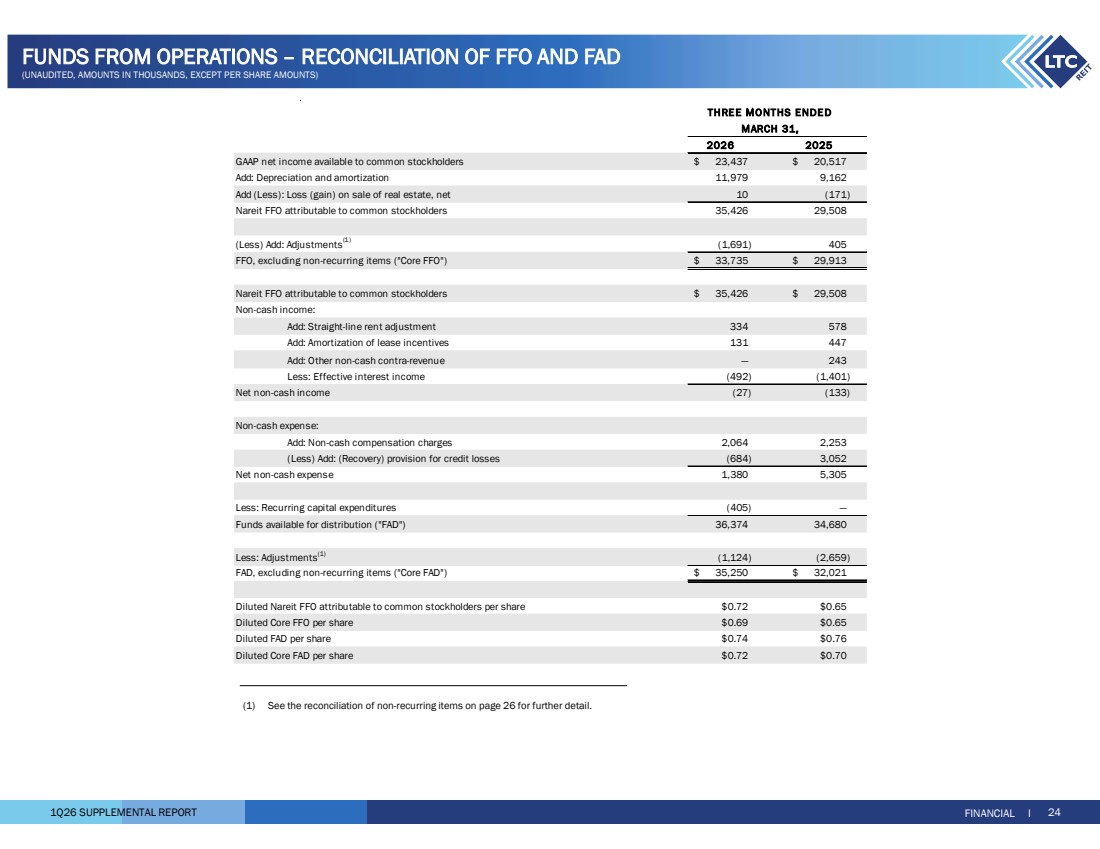
| 1Q26 SUPPLEMENTAL REPORT 2026 2025 GAAP net income available to common stockholders 23,437 $ 20,517 $ Add: Depreciation and amortization 11,979 9,162 Add (Less): Loss (gain) on sale of real estate, net 10 (171) Nareit FFO attributable to common stockholders 35,426 29,508 (Less) Add: Adjustments(1) 405 (1,691) $ 29,913 33,735 $ Nareit FFO attributable to common stockholders 35,426 $ 29,508 $ Non-cash income: Add: Straight-line rent adjustment 334 578 Add: Amortization of lease incentives 131 447 Add: Other non-cash contra-revenue — 243 Less: Effective interest income (492) (1,401) Net non-cash income (27) (133) Non-cash expense: Add: Non-cash compensation charges 2,064 2,253 (Less) Add: (Recovery) provision for credit losses (684) 3,052 Net non-cash expense 1,380 5,305 Less: Recurring capital expenditures (405) — Funds available for distribution ("FAD") 36,374 34,680 Less: Adjustments(1) (2,659) (1,124) FAD, excluding non-recurring items ("Core FAD") 35,250 $ 32,021 $ $0.72 $0.65 $0.69 $0.65 $0.74 $0.76 $0.72 $0.70 THRE E MONTHS ENDE D MARCH 31, Diluted Nareit FFO attributable to common stockholders per share Diluted Core FFO per share Diluted FAD per share Diluted Core FAD per share FFO, excluding non-recurring items ("Core FFO") FINANCIAL I 24 FUNDS FROM OPERATIONS – RECONCILIATION OF FFO AND FAD (UNAUDITED, AMOUNTS IN THOUSANDS, EXCEPT PER SHARE AMOUNTS) (1) See the reconciliation of non-recurring items on page 26 for further detail. |
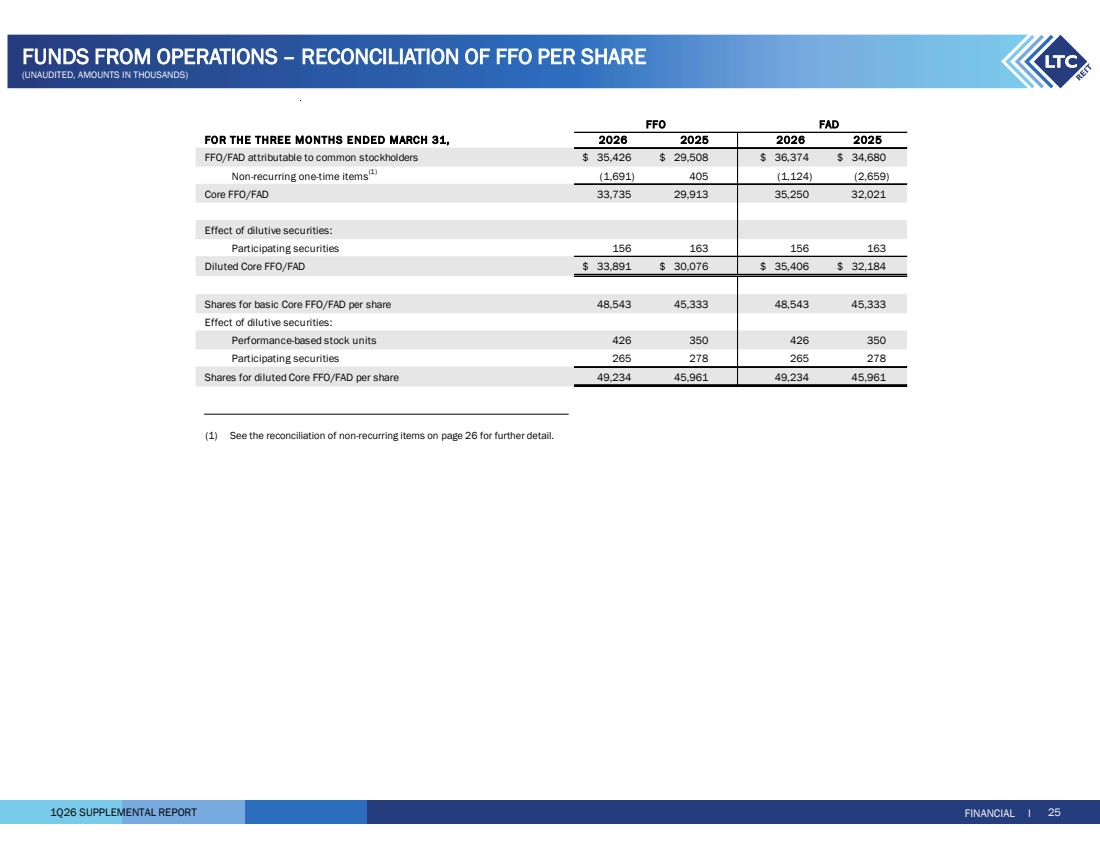
| 1Q26 SUPPLEMENTAL REPORT FOR THE THREE MONTHS ENDED MARCH 31, FFO/FAD attributable to common stockholders 35,426 $ 29,508 $ 36,374 $ 34,680 $ Non-recurring one-time items(1) 405 (1,691) (1,124) (2,659) Core FFO/FAD 33,735 29,913 35,250 32,021 Effect of dilutive securities: Participating securities 156 163 156 163 Diluted Core FFO/FAD 33,891 $ 30,076 $ 35,406 $ 32,184 $ 45,333 48,543 48,543 45,333 Effect of dilutive securities: Performance-based stock units 426 350 426 350 Participating securities 265 278 265 278 Shares for diluted Core FFO/FAD per share 49,234 45,961 49,234 45,961 Shares for basic Core FFO/FAD per share FFO FAD 2026 2025 2026 2025 FINANCIAL I 25 FUNDS FROM OPERATIONS – RECONCILIATION OF FFO PER SHARE (UNAUDITED, AMOUNTS IN THOUSANDS) (1) See the reconciliation of non-recurring items on page 26 for further detail. |
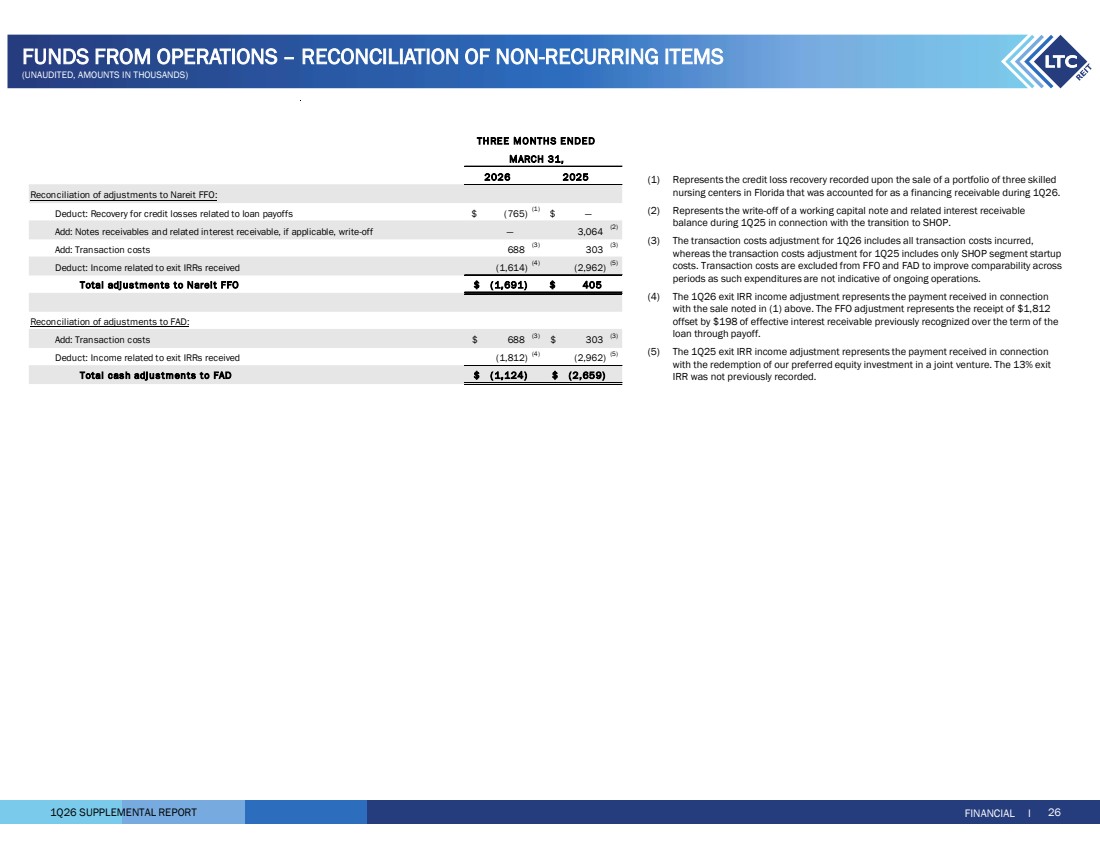
| 1Q26 SUPPLEMENTAL REPORT 2026 2025 Reconciliation of adjustments to Nareit FFO: Deduct: Recovery for credit losses related to loan payoffs (765) $ (1) $ — Add: Notes receivables and related interest receivable, if applicable, write-off — 3,064 (2) Add: Transaction costs 688 (3) 303 (3) Deduct: Income related to exit IRRs received (1,614) (4) (2,962) (5) Total adjus tments to Nareit FFO ( 1,691) $ 405 $ Reconciliation of adjustments to FAD: Add: Transaction costs 688 $ (3) $ 303 (3) Deduct: Income related to exit IRRs received (1,812) (4) (2,962) (5) Total cash adjus tments to FAD ( 1,124) $ (2,659) $ THREE MONTHS ENDED MARCH 31, FINANCIAL I 26 FUNDS FROM OPERATIONS – RECONCILIATION OF NON-RECURRING ITEMS (UNAUDITED, AMOUNTS IN THOUSANDS) (1) Represents the credit loss recovery recorded upon the sale of a portfolio of three skilled nursing centers in Florida that was accounted for as a financing receivable during 1Q26. (2) Represents the write-off of a working capital note and related interest receivable balance during 1Q25 in connection with the transition to SHOP. (3) The transaction costs adjustment for 1Q26 includes all transaction costs incurred, whereas the transaction costs adjustment for 1Q25 includes only SHOP segment startup costs. Transaction costs are excluded from FFO and FAD to improve comparability across periods as such expenditures are not indicative of ongoing operations. (4) The 1Q26 exit IRR income adjustment represents the payment received in connection with the sale noted in (1) above. The FFO adjustment represents the receipt of $1,812 offset by $198 of effective interest receivable previously recognized over the term of the loan through payoff. (5) The 1Q25 exit IRR income adjustment represents the payment received in connection with the redemption of our preferred equity investment in a joint venture. The 13% exit IRR was not previously recorded. |
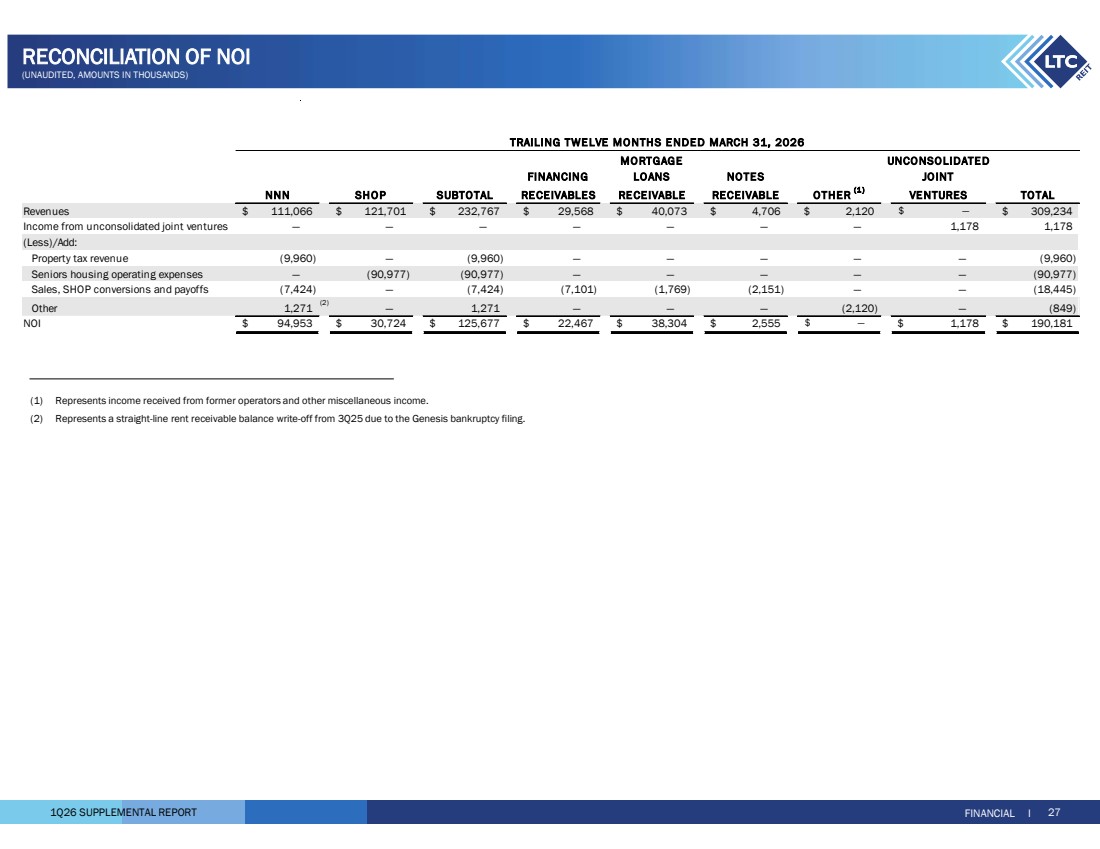
| 1Q26 SUPPLEMENTAL REPORT FINANCIAL I 27 MORTGAGE UNCONSOLIDATE D FINANCING LOANS NOTE S JOINT NNN SHOP SUBTOTAL RE CEIVABLE S RE CEIVABLE RECEIVABLE OTHER (1 ) VE NTURES TO TAL Revenues 111,066 $ 121,701 $ 232,767 $ 29,568 $ 40,073 $ 4,706 $ 2,120 $ $ — $ 309,234 Income from unconsolidated joint ventures — — — — — — — 1,178 1,178 (Less)/Add: Property tax revenue (9,960) — (9,960) — — — — — (9,960) Seniors housing operating expenses — (90,977) (90,977) — — — — — (90,977) Sales, SHOP conversions and payoffs (7,424) — (7,424) (7,101) (1,769) (2,151) — — (18,445) Other 1,271 (2) 1,271 — — — — (2,120) — (849) NOI 94,953 $ 30,724 $ 125,677 $ 22,467 $ 38,304 $ 2,555 $ $ — $ 190,181 1,178 $ TRAILING TWE LVE MONTHS E NDED MARCH 31, 2026 (1) Represents income received from former operators and other miscellaneous income. (2) Represents a straight-line rent receivable balance write-off from 3Q25 due to the Genesis bankruptcy filing. RECONCILIATION OF NOI (UNAUDITED, AMOUNTS IN THOUSANDS) |
| 1Q26 SUPPLEMENTAL REPORT Annualized Contractual Cash NOI: Represents annualized contractual cash rental income (prior to abatements & deferred rent repayment and excludes real estate tax reimbursement), interest income from financing receivables, mortgage loans, mezzanine loans and working capital notes, and income from unconsolidated joint ventures for the final month of the quarter reported herein. Annualized GAAP NOI: Represents annualized GAAP rent which includes contractual cash rent, straight-line rent and amortization of lease incentives and excludes real estate tax reimbursement, GAAP interest income from financing receivables, mortgage loans, mezzanine loans and working capital notes, and income from unconsolidated joint ventures for the final month of the quarter reported herein. Assisted Living Communities (“ALF”): The ALF portfolio consists of assisted living, independent living, and/or memory care properties (see definitions for Independent Living and Memory Care Communities). Assisted living properties are seniors housing properties serving elderly persons who require assistance with activities of daily living, but do not require the constant supervision skilled nursing properties provide. Services are usually available 24 hours a day and include personal supervision and assistance with eating, bathing, grooming and administering medication. The facilities provide a combination of housing, supportive services, personalized assistance and health care designed to respond to individual needs. Contractual Lease Rent: Rental revenue as defined by the lease agreement between us and the operator for the lease year. Core SHOP Portfolio: Represents the 27 properties (2,281 units) that include initial conversions (13) and acquired SHOP properties (14) through 1Q26; excludes value-add conversions and additional acquisitions. Coronavirus Stimulus Funds (“CSF”): CSF includes funding from various state and federal programs to support healthcare providers in dealing with the challenges of the coronavirus pandemic. Included in CSF are state-specific payments identified by operators as well as federal payments connected to the Paycheck Protection Program and the Provider Relief Fund. CSF is self-reported by operators in unaudited financial statements provided to LTC. Specifically excluded from CSF are the suspension of the Medicare sequestration cut, and increases to the Federal Medical Assistance Percentages (FMAP), both of which are reflected in reported coverage both including and excluding CSF. Earnings Before Interest, Tax, Depreciation and Amortization for Real Estate (“EBITDAre”): As defined by the National Association of Real Estate Investment Trusts (“Nareit”), EBITDAre is calculated as net income (computed in accordance with GAAP) excluding (i) interest expense, (ii) income tax expense, (iii) real estate depreciation and amortization, (iv) impairment write-downs of depreciable real estate, (v) gains or losses on the sale of depreciable real estate, and (vi) adjustments for unconsolidated partnerships and joint ventures. EXPOR: Average expenses per occupied room per month FAD Capex: Recurring capital expenditures that extend the useful life of a property Financing Receivables: Properties acquired through a sale-leaseback transaction with an operating entity being the same before and after the sale-leaseback, subject to a lease contract that contains a purchase option. In accordance with GAAP, the purchased assets are required to be presented as Financing receivables on our Consolidated Balance Sheets and the rental income to be presented as Interest income from financing receivables on our Consolidated Statements of Income. Funds Available for Distribution (“FAD”): FFO excluding the effects of straight-line rent, amortization of lease costs, effective interest income, provision for credit losses, non-cash compensation charges, non-cash interest charges and recurring capital expenditures required to maintain and re-tenant our properties. Funds From Operations (“FFO”): As defined by Nareit, net income available to common stockholders (computed in accordance with U.S. GAAP) excluding gains or losses on the sale of real estate and impairment write-downs of depreciable real estate plus real estate depreciation and amortization, and after adjustments for unconsolidated partnerships and joint ventures. GAAP Rent: Total rent we will receive as a fixed amount over the initial term of the lease and recognized evenly over that term. GAAP rent recorded in the early years of a lease is higher than the cash rent received and during the later years of the lease, the cash rent received is higher than GAAP rent recognized. The difference between the cash rent and GAAP rent is commonly referred to as straight-line rental income. GAAP rent also includes amortization of lease incentives and real estate tax reimbursements. Gross Asset Value: The carrying amount of total assets after adding back accumulated depreciation and loan loss reserves, as reported in the company’s consolidated financial statements. Gross Investment: Original price paid for an asset plus capital improvements funded by LTC, without any deductions for depreciation or provision for credit losses. Gross Investment is commonly referred to as undepreciated book value. Independent Living Communities (“ILF”): Seniors housing properties offering a sense of community and numerous levels of service, such as laundry, housekeeping, dining options/meal plans, exercise and wellness programs, transportation, social, cultural and recreational activities, on-site security and emergency response programs. Many offer on-site conveniences like beauty/barber shops, fitness facilities, game rooms, libraries and activity centers. ILFs are also known as retirement communities or seniors apartments. Initial Conversion: 13 properties converted to SHOP in 2Q25. Interest Income: Represents interest income from financing receivables, mortgage loans and other notes. Licensed Beds/Units: The number of beds and/or units that an operator is authorized to operate at seniors housing and long-term care properties. Licensed beds and/or units may differ from the number of beds and/or units in service at any given time. Memory Care Communities (“MC”): Seniors housing properties offering specialized options for seniors with Alzheimer’s disease and other forms of dementia. These facilities offer dedicated care and specialized programming for various conditions relating to memory loss in a secured environment that is typically smaller in scale and more residential in nature than traditional assisted living facilities. These facilities have staff available 24 hours a day to respond to the unique needs of their residents. Metropolitan Statistical Areas (“MSA”): Based on the U.S. Census Bureau, MSA is a geographic entity defined by the Office of Management and Budget (OMB) for use by Federal statistical agencies in collecting, tabulating, and publishing Federal statistics. A metro area contains a core urban area of 50,000 or more population. MSAs 1 to 31 have a population of 19.5M – 2.2M. MSAs 32 to 100 have a population of 2.2M – 0.6M. MSAs greater than 100 have a population of 0.6M – 58K. Cities in a Micro-SA have a population of 264K – 12K. Cities not in an MSA have a population of less than 100K. Mezzanine: Mezzanine financing sits between senior debt and common equity in the capital structure, and typically is used to finance development projects, value-add opportunities on existing operational properties, partnership buy-outs and recapitalization of equity. Security for mezzanine loans can include all or a portion of the following credit enhancements: secured second mortgage, pledge of equity interests, and personal/corporate guarantees. Mezzanine loans can be recorded for GAAP purposes as either a loan or joint venture depending upon loan terms and related credit enhancements. GLOSSARY I 28 GLOSSARY |
| 1Q26 SUPPLEMENTAL REPORT Micropolitan Statistical Areas (“Micro-SA”): Based on the U.S. Census Bureau, Micro-SA is a geographic entity defined by the Office of Management and Budget (OMB) for use by Federal statistical agencies in collecting, tabulating, and publishing Federal statistics. A micro area contains an urban core of at least 10,000 population. Mortgage Loan: Mortgage financing is provided on properties based on our established investment underwriting criteria and secured by a first mortgage. Subject to underwriting, additional credit enhancements may be required including, but not limited to, personal/corporate guarantees and debt service reserves. When possible, LTC attempts to negotiate a purchase option to acquire the property at a future time and lease the property back to the borrower. Net Real Estate Assets: Gross real estate investment less accumulated depreciation. Net Real Estate Asset is commonly referred to as Net Book Value (“NBV”). NNN – Triple-net lease which requires the lessee to pay all taxes, insurance, maintenance and repair capital and non-capital expenditures and other costs necessary in the operations of the property. Non-cash Revenue: Straight-line rental income, amortization of lease inducement and effective interest. Non-cash Compensation Charges: Vesting expense relating to restricted stock and performance-based stock units. Non-FAD Capex: Capital expenditures, including significant renovations, to bring a property to a marketable and functional standard. Normalized EBITDAR Coverage: The trailing twelve month’s earnings from the operator financial statements adjusted for non-recurring, infrequent, or unusual items and before interest, taxes, depreciation, amortization, and rent divided by the operator’s contractual lease rent. Management fees are imputed at 5% of revenues. Normalized EBITDARM Coverage: The trailing twelve month’s earnings from the operator financial statements adjusted for non-recurring, infrequent, or unusual items and before interest, taxes, depreciation, amortization, rent, and management fees divided by the operator’s contractual lease rent. Occupancy: The weighted average percentage of all beds and/or units that are occupied at a given time. The calculation uses the trailing twelve months and is based on licensed beds and/or units which may differ from the number of beds and/or units in service at any given time. Operator Financial Statements: Property level operator financial statements which are unaudited and have not been independently verified by us. Payor Source: LTC revenue by operator underlying payor source for the period presented. LTC is not a Medicaid or a Medicare recipient. Statistics represent LTC's rental revenues times operators' underlying payor source revenue percentage. Underlying payor source revenue percentage is calculated from property level operator financial statements which are unaudited and have not been independently verified by us. Private Pay: Private pay includes private insurance, HMO, VA, and other payors. Purchase Price: Represents the fair value price of an asset that is exchanged in an orderly transaction between market participants at the measurement date. An orderly transaction is a transaction that assumes exposure to the market for a period prior to the measurement date to allow for marketing activities that are usual and customary for transactions involving such assets; it is not a forced transaction (for example, a forced liquidation or distress sale). Real Estate Investments: Represents our investments in real property, financing receivables, mortgage loans receivable and other notes receivables. Rental Income: Represents GAAP rent generated by our owned properties under triple-net leases. REVPOR: Average revenues per occupied room per month RIDEA: Real Estate Investment Trust (REIT) Investment Diversification and Empowerment Act of 2007 Same Property Portfolio (“SPP”): Same property statistics allow for the comparative evaluation of performance across a consistent population of LTC’s leased property portfolio and the Prestige Healthcare mortgage loan portfolio. Our SPP is comprised of stabilized properties occupied and operated throughout the duration of the quarter-over-quarter comparison periods presented (excluding assets sold, assets held-for-sale and SHOP assets). Accordingly, a property must be occupied and stabilized or a minimum of 15 months to be included in our SPP. Each property transitioned to a new operator has been excluded from SPP and will be added back to SPP for the SPP reporting period ending 15 months after the date of the transition. Seniors Housing (“SH”): Consists of independent living, assisted living, and/or memory care properties. Seniors Housing Operating Portfolio (“SHOP”): Includes Seniors Housing properties generally structured to comply with RIDEA. SHOP Net Operating Income (“NOI”): Total SHOP revenues (resident fees and services) less total SHOP expenses (seniors housing operating expenses). Skilled Nursing Properties (“SNF”): Seniors housing properties providing restorative, rehabilitative and nursing care for people not requiring the more extensive and sophisticated treatment available at acute care hospitals. Many SNFs provide ancillary services that include occupational, speech, physical, respiratory and IV therapies, as well as sub-acute care services which are paid either by the patient, the patient’s family, private health insurance, or through the federal Medicare or state Medicaid programs. Stabilized: Properties are generally considered stabilized upon the earlier of achieving certain occupancy thresholds (e.g. 80% for SNFs and 90% for ALFs) and, as applicable, 12 months from the date of acquisition/lease transition/restructure or, in the event of a de novo development, redevelopment, major renovations or addition, 24 months from the date the property is first placed in or returned to service, or properties acquired in lease-up. Trailing Twelve Months NOI: For the owned portfolio under triple-net leases, rental income excluding real estate tax reimbursement, straight-line rent write-off and rental income from properties sold during the trailing twelve months. For the owned portfolio under our SHOP segment, represents SHOP NOI during the trailing twelve months. For owned properties accounted for as financing receivables, mortgage loan receivables and notes receivables, NOI includes cash interest income and effective interest during the trailing twelve months and excludes loan payoffs during the trailing twelve months. For Unconsolidated JV, NOI includes income from our investments in joint ventures during the trailing twelve months. Under Development Properties (“UDP”): Development projects to construct seniors housing properties. Value-Add Conversion: Properties converted to date, or planned to be converted, from our market-based rent reset portfolio – 1 campus converted in 4Q25 (previously disclosed as 2 properties); 2 properties converted in 1Q26; and 2 properties expected to be converted in 2Q26. GLOSSARY I 29 GLOSSARY |
| 1Q26 SUPPLEMENTAL REPORT FORWARD-LOOKING STATEMENTS This supplemental information contains forward-looking statements within the meaning of Section 27A of the Securities Act of 1933, as amended, and Section 21E of the Securities Exchange Act of 1934, as amended, adopted pursuant to the Private Securities Litigation Reform Act of 1995. Statements that are not purely historical may be forward-looking. You can identify some of the forward-looking statements by their use of forward-looking words, such as ‘‘believes,’’ ‘‘expects,’’ ‘‘may,’’ ‘‘will,’’ ‘‘should,’’ ‘‘seeks,’’ ‘‘approximately,’’ ‘‘intends,’’ ‘‘plans,’’ ‘‘estimates’’ or ‘‘anticipates,’’ or the negative of those words or similar words. Examples of forward-looking statements include the Company’s 2025 full-year guidance and statements regarding the Company’s SHOP pipeline, anticipated growth, and future strategy. Forward- looking statements involve inherent risks and uncertainties regarding events, conditions and financial trends that may affect our future plans of operation, business strategy, results of operations and financial position. A number of important factors could cause actual results to differ materially from those included within or contemplated by such forward-looking statements, including, but not limited to, our dependence on our operators for revenue and cash flow; government regulation of the health care industry; changes in federal, state, or local laws limiting REIT investments in the health care sector; federal and state health care cost containment measures including reductions in reimbursement from third-party payors such as Medicare and Medicaid; required regulatory approvals for operation of health care facilities; a failure to comply with federal, state, or local regulations for the operation of health care facilities; the adequacy of insurance coverage maintained by our operators; our reliance on a few major operators; our ability to renew leases or enter into favorable terms of renewals or new leases; the impact of inflation, operator financial or legal difficulties; the sufficiency of collateral securing mortgage loans; an impairment of our real estate investments; the relative illiquidity of our real estate investments; our ability to develop and complete construction projects; our ability to invest cash proceeds for health care properties; a failure to qualify as a REIT; our ability to grow if access to capital is limited; and a failure to maintain or increase our dividend. For a discussion of these and other factors that could cause actual results to differ from those contemplated in the forward-looking statements, please see the discussion under ‘‘Risk Factors’’ and other information contained in our Annual Report on Form 10-K for the fiscal year ended December 31, 2025 and in our publicly available filings with the Securities and Exchange Commission. We do not undertake any responsibility to update or revise any of these factors or to announce publicly any revisions to forward-looking statements, whether as a result of new information, future events or otherwise. Although our management believes that the assumptions and expectations reflected in such forward-looking statements are reasonable, no assurance can be given that such expectations will prove to have been correct. The actual results achieved may differ materially from any forward-looking statements due to the risks and uncertainties of such statements. 30 Founded in 1992, LTC Properties, Inc. (NYSE: LTC) is a self-administered real estate investment trust (REIT) investing in seniors housing and health care properties primarily through RIDEA, triple-net leases, joint ventures and structured finance solutions including preferred equity and mezzanine lending. LTC’s portfolio encompasses Skilled Nursing Facilities (SNF) and Seniors Housing (SH) consisting of Assisted Living Communities (ALF), Independent Living Communities (ILF), Memory Care Communities (MC) and combinations thereof. Our main objective is to build and grow a diversified portfolio that creates and sustains shareholder value while providing our stockholders current distribution income. To meet this objective, we seek properties operated by regional operators, ideally offering upside and portfolio diversification (geographic, operator, property type and investment vehicle). For more information, visit www.LTCreit.com. FORWARD-LOOKING STATEMENTS AND NON-GAAP INFORMATION NON-GAAP INFORMATION This supplemental information contains certain non-GAAP information including EBITDAre, adjusted EBITDAre, FFO, FFO excluding non-recurring items, FAD, FAD excluding non-recurring items, adjusted interest coverage ratio, adjusted fixed charges coverage ratio and NOI. A reconciliation of this non-GAAP information is provided on pages 21, 24, 25, 26 and 27 of this supplemental information, and additional information is available under the “Non-GAAP Financial Measures” subsection under the “Filings” section of our website at www.LTCreit.com. |